. 2019 Jan;224(1):373-386.
doi: 10.1007/s00429-018-1775-1. Epub 2018 Oct 19.

Deficiency of the clock gene Bmal1 affects neural progenitor cell migration

Affiliations

Deficiency of the clock gene Bmal1 affects neural progenitor cell migration

Amira A H Ali et al. Brain Struct Funct. 2019 Jan.

Abstract

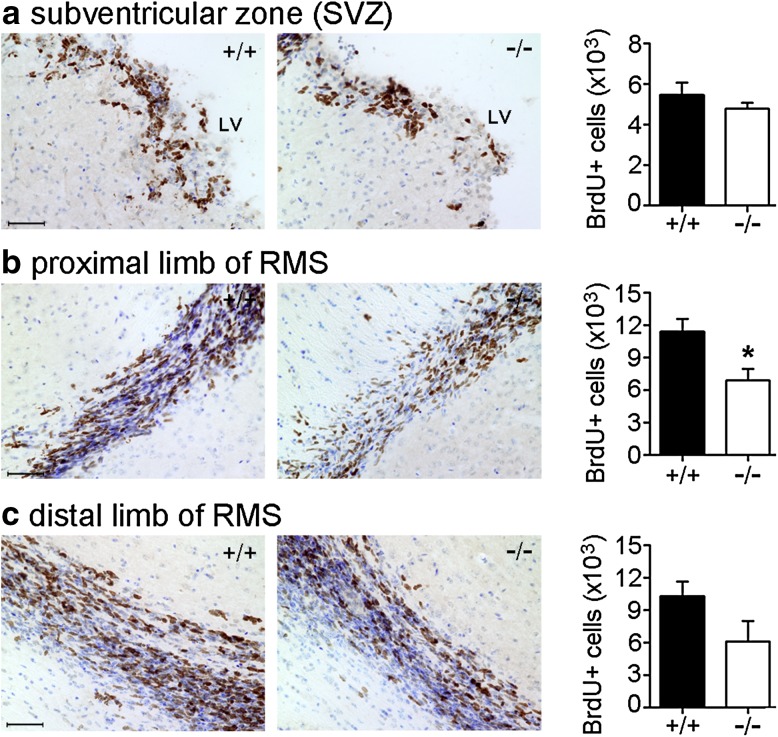
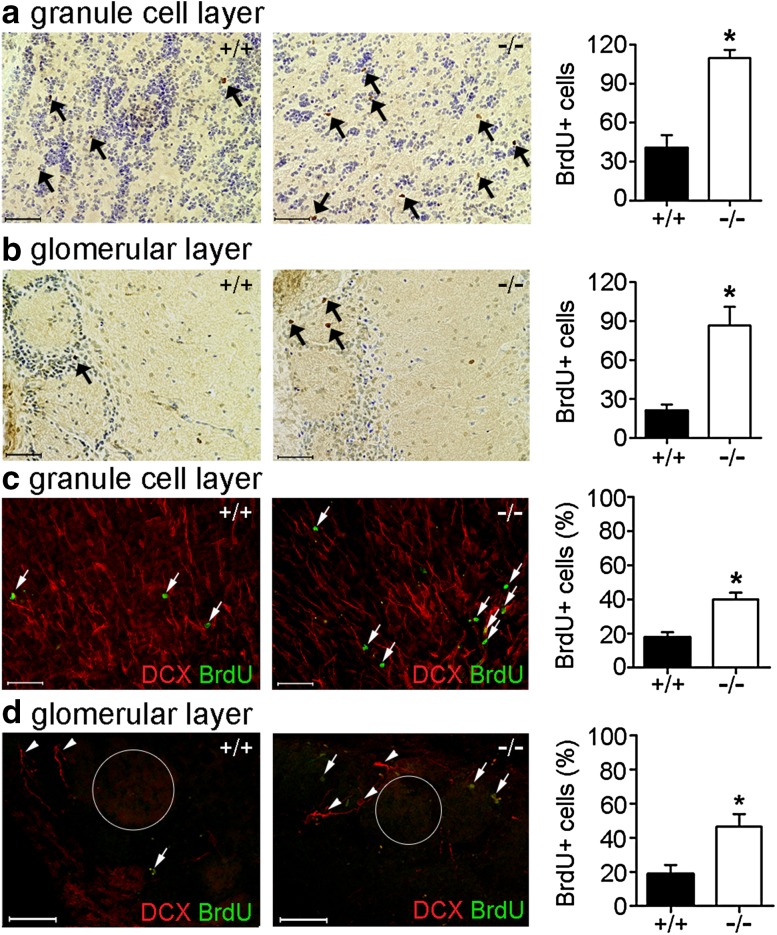
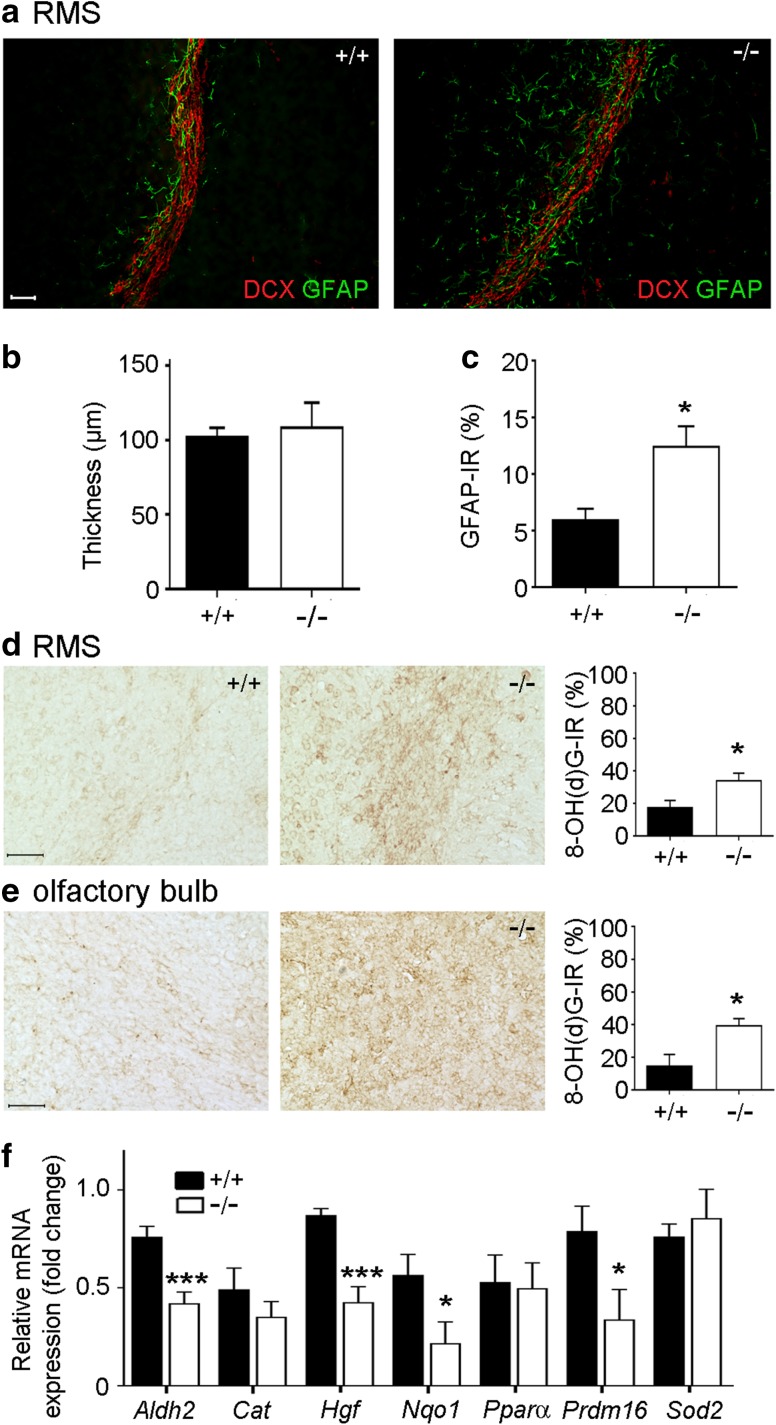
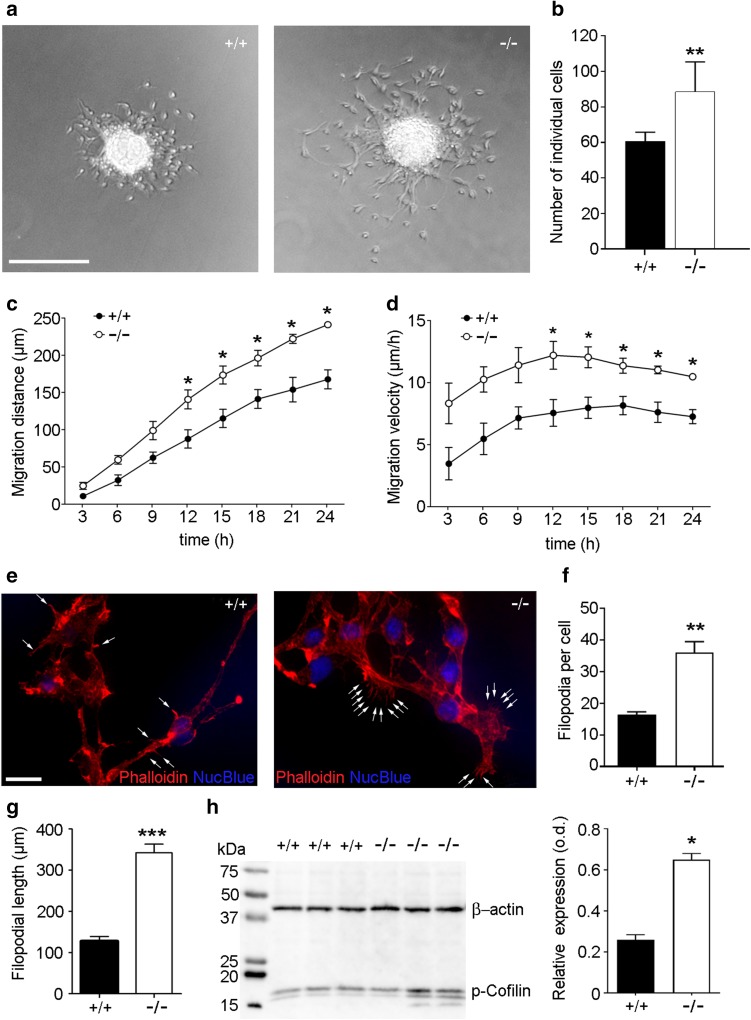
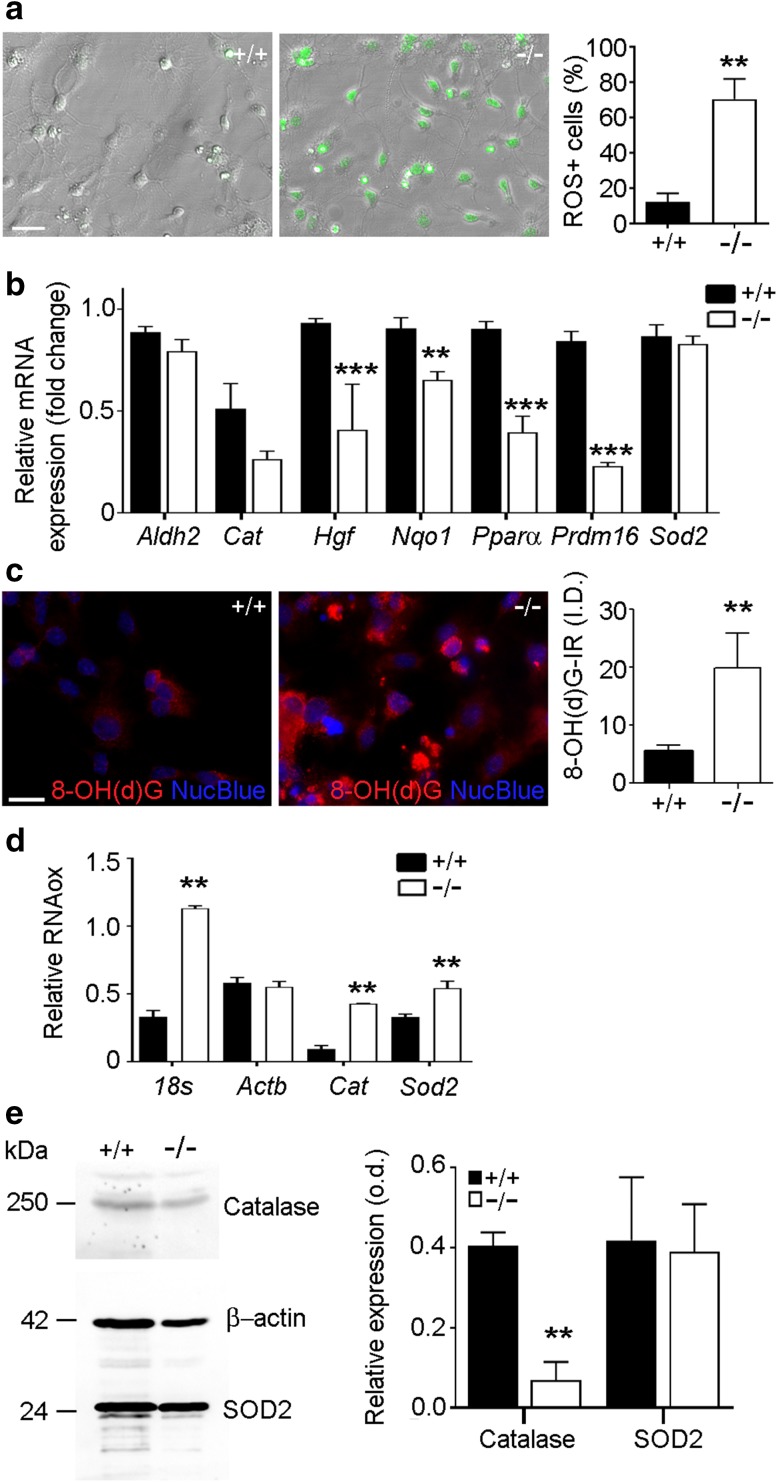
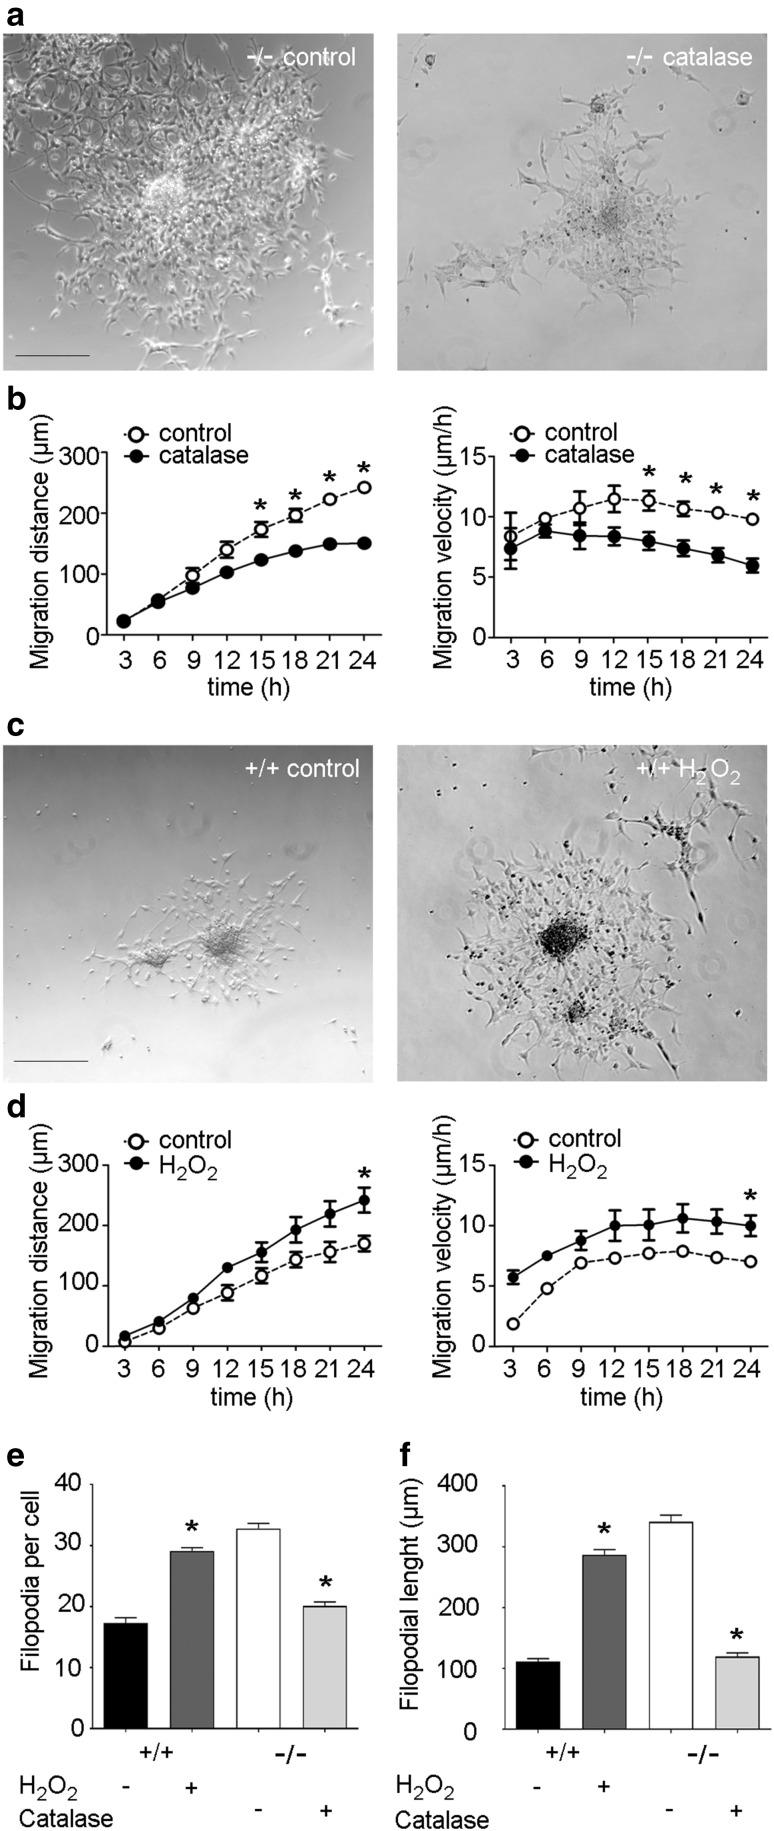
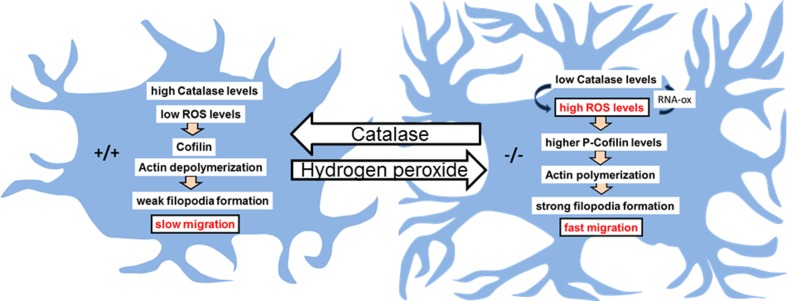
We demonstrate the impact of a disrupted molecular clock in Bmal1-deficient (Bmal1-/-) mice on migration of neural progenitor cells (NPCs). Proliferation of NPCs in rostral migratory stream (RMS) was reduced in Bmal1-/- mice, consistent with our earlier studies on adult neurogenesis in hippocampus. However, a significantly higher number of NPCs from Bmal1-/- mice reached the olfactory bulb as compared to wild-type littermates (Bmal1+/+ mice), indicating a higher migration velocity in Bmal1-/- mice. In isolated NPCs from Bmal1-/- mice, not only migration velocity and expression pattern of genes involved in detoxification of reactive oxygen species were affected, but also RNA oxidation of catalase was increased and catalase protein levels were decreased. Bmal1+/+ migration phenotype could be restored by treatment with catalase, while treatment of NPCs from Bmal1+/+ mice with hydrogen peroxide mimicked Bmal1-/- migration phenotype. Thus, we conclude that Bmal1 deficiency affects NPC migration as a consequence of dysregulated detoxification of reactive oxygen species.

Keywords: Bmal1; Catalase; Circadian; Clock genes; Cytoskeleton; Filopodia; Hydrogen peroxide; RNA oxidation; Rostral migratory stream; Subventricular zone; p-Cofilin.


Conflict of interest statement

The authors declare no competing financial interests.

Figures

Fig. 1
Fig. 1
Bmal1 deficiency affects NPC proliferation. Representative photomicrographs of BrdU immunoreaction (brown precipitate) and quantification of BrdU-immunopositive cells in the subventricular zone (SVZ) and rostral migratory stream (RMS) in Bmal1+/+ mice (+/+) and Bmal1−/− mice (-/-) four days after the first day of BrdU injection. Counterstaining with cresyl violet (blue) was used to highlight the anatomical locations. a Subventricular zone (SVZ), LV lateral ventricle b proximal limb of RMS, *P < 0.05. c Distal limb of (RMS). n = 4 mice per genotype. Scale bars = 50 µm
Fig. 2
Fig. 2
Bmal1 deficiency affects the number of newly developed neurons reaching the olfactory bulb within 4 days. Representative photomicrographs and quantification of BrdU-immunopositive cells (arrows) in the olfactory bulb of Bmal1+/+ mice (+/+) and Bmal1−/− mice (-/-). BrdU immunoreaction (brown precipitate) and cresyl violet staining (blue) in (a) granule cell layer (b) glomerular layer. Immunofluorescence for BrdU and DCX, as a marker of newly developed neurons, and quantification of DCX+/BrdU+ cell as percentage of total BrdU+ cells in (c) granule cell layer, (d) glomerular layer, arrowheads indicate DCX+ cells, glomeruli are indicated by circles. *P < 0.05, n = 4 mice per genotype. Scale bars = 50 µm
Fig. 3
Fig. 3
Bmal1 deficiency affects formation of the glial tube surrounding the RMS, oxidative stress and ROS defense gene expression. a Representative photomicrographs show DCX+ migrating neuroblasts forming the RMS surrounded by GFAP+ glia cells in Bmal1+/+ mice (+/+) and Bmal1−/− mice (−/−). Scale bar = 50 µm. b Quantification of RMS thickness, determined by DCX immunoreaction (IR), n = 4 per genotype c quantification of glial tube surrounding the RMS, determined by GFAP-IR, *P < 0.05, n = 4 per genotype. d Representative photomicrographs and quantification of 8-OH(d)G -IR in RMS of Bmal1+/+ mice (n = 4) and Bmal1−/− mice (n = 5), *P < 0.05. Scale bar = 50 µm. e Representative photomicrographs and quantification of 8-OH(d)G-IR in the olfactory bulb of Bmal1+/+ mice (n = 4) and Bmal1−/− mice (n = 5), *P < 0.05. Scale bar = 50 µm. f Quantification of relative ROS defense gene expression in Bmal1+/+ mice (black bars, n = 9) and Bmal1−/− mice (n = 7, white bars), *P < 0.05, ***P < 0.001
Fig. 4
Fig. 4
Bmal1 deficiency affects migration of NPCs, filopodia morphology and phospho-cofilin expression in vitro. a Representative microphotographs of neurospheres and out-migrating NPCs derived from Bmal1+/+ mice (+/+) and Bmal1−/− mice (−/−). Scale bar = 300 µm. b Quantification of detached NPCs 24 h after seeding. The number of detached NPCs was significantly higher in Bmal1−/− as compared to Bmal1+/+, *P < 0.05, n = 6 mice per genotype. c Migration distance and consequently (d) migration velocity were significantly different between Bmal1+/+ and Bmal1−/− during the first 24 h after seeding *P < 0.05, n = 4 mice per genotype. e Representative photomicrographs of neuroblasts 24 h after seeding with F-actin staining (Phalloidin) and nuclei staining (NucBlue), scale bar 20 µm. Arrows indicate filopodia. f Quantification of filopodia number per cell, **P < 0.01, n = 6 mice per genotype (g) Quantification of filopodial length, **P < 0.01, n = 6 mice per genotype h representative immunoblots and quantification of phospho (p)-cofilin in NPCs from Bmal1+/+ mice and Bmal1−/− mice. *P < 0.05, n = 4 mice per genotype
Fig. 5
Fig. 5
Bmal1 deficiency is associated with high ROS production, reduced ROS defense gene expression, increased RNA oxidation and decreased catalase levels in NPCs. a Representative photomicrographs and quantification of NPCs derived from Bmal1+/+ mice (+/+) and Bmal1−/− mice (−/−) with ROS-sensitive dye CellROX® 24 h after seeding, **P < 0.001, n = 6 mice per genotype. Scale bar = 30 µm (b) quantification of relative ROS defense gene expression in Bmal1+/+ mice and Bmal1−/− mice, n = 9 mice per genotype. **P < 0.01; ***P < 0.0001. c Representative photomicrographs and quantification of 8-OH(d)G immunoreaction (IR, red) in NPCs as integrated density (I.D.), **P < 0.01, n = 5 mice per genotype. Scale bar = 20 µm d quantification of oxidized RNA (RNAox) levels after immunopurification from total RNA with 8-OH(d)G antibody. **P < 0.001, n = 6 mice per genotype. e Representative immunoblots and quantification of relative catalase and SOD2. **P < 0.01, n = 6 mice per genotype
Fig. 6
Fig. 6
Treatment with catalase restores wild-type migration phenotype, treatment with hydrogen peroxide mimics Bmal1-deficient migration phenotype. a Representative photomicrographs of NPCs from Bmal1−/− mice (−/−) treated with vehicle (control) or 500 U/ml catalase (catalase) for 24 h. Scale bar: 200 µm. b Time course of migration distance and velocity after treatment of NPCs from Bmal1−/− mice with vehicle (control) or 500 U/ml catalase (catalase) during the first 24 h after seeding. *P < 0.05, n = 4 mice per group. c Representative photomicrographs of NPCs from Bmal1+/+ mice (+/+) treated with vehicle (control) or 80 µM hydrogen peroxide (H2O2) for 24 h. Scale bar: 200 µm. d Time course of migration distance and velocity after treatment of NPCs from Bmal1+/+ mice with vehicle (control) or 80 µM H2O2 (H2O2) during the first 24 h after seeding. *P < 0.05, n = 4 mice per group. e Quantification of filopodia number in NPCs from Bmal1+/+ mice treated with (+) or without (−) H2O2 or in NPCs from Bmal1−/− mice treated with (+) or without (−) catalase. *P < 0.05, n = 4 mice per genotype. f Quantification of filopodia length in NPCs from Bmal1+/+ mice treated with (+) or without (−) H2O2 or in NPCs from Bmal1−/− mice treated with (+) or without (−) catalase. *P < 0.05, n = 4 mice per group
Fig. 7
Fig. 7
Model for the effect of Bmal1 deficiency on neural progenitor cell (NPC) migration. In NPCs of Bmal1-deficient mice (−/−) impaired detoxification of reactive oxygen species (ROS) results in enhanced RNA oxidation (RNAox). Oxidation of catalase mRNA leads to decreased catalase protein levels and thus further enhancing ROS accumulation. This is associated with a higher level of the ROS-sensitive mediator of actin polymerization p-Cofilin and with stronger filopodia formation and higher migration velocity. Exogenous application of catalase in NPCs from Bmal1−/− mice leads to a reduction of ROS levels and to a wild-type (+/+) filopodia and migration phenotype. Vice versa, exogenous application of hydrogen peroxide in NPCs from Bmal1+/+ mice leads to a Bmal1−/− (−/−) filopodia and migration phenotype

Similar articles

Cited by

References

    1. Ali AA, et al. Premature aging of the hippocampal neurogenic niche in adult Bmal1-deficient mice. Aging (Albany NY) 2015;7(6):435–449. doi: 10.18632/aging.100764. - DOI - PMC - PubMed
    1. Baumann J, et al. Comparative human and rat “neurosphere assay” for developmental neurotoxicity testing. Curr Protoc Toxicol. 2014;59:12. - PubMed
    1. Baumann JDK, Barenys M, Giersiefer S, Goniwiecha J, Lein PJ, Fritsche E. Application of the neurosphere assay for DNT hazard assessment: challenges and limitations. In: Kang YJ, editor. Methods in pharmacology and toxicology. Berlin: Springer; 2015.
    1. Bernstein BW, Bamburg JR. ADF/cofilin: a functional node in cell biology. Trends Cell Biol. 2010;20(4):187–195. doi: 10.1016/j.tcb.2010.01.001. - DOI - PMC - PubMed
    1. Bouchard-Cannon P, et al. The circadian molecular clock regulates adult hippocampal neurogenesis by controlling the timing of cell-cycle entry and exit. Cell Rep. 2013;5(4):961–973. doi: 10.1016/j.celrep.2013.10.037. - DOI - PubMed

Publication types

MeSH terms

LinkOut - more resources