

CYP1A1 and 1B1-mediated metabolic pathways of dolutegravir, an HIV integrase inhibitor
- PMID: 30342022
- PMCID: PMC6263788
- DOI: 10.1016/j.bcp.2018.10.012
CYP1A1 and 1B1-mediated metabolic pathways of dolutegravir, an HIV integrase inhibitor
Abstract
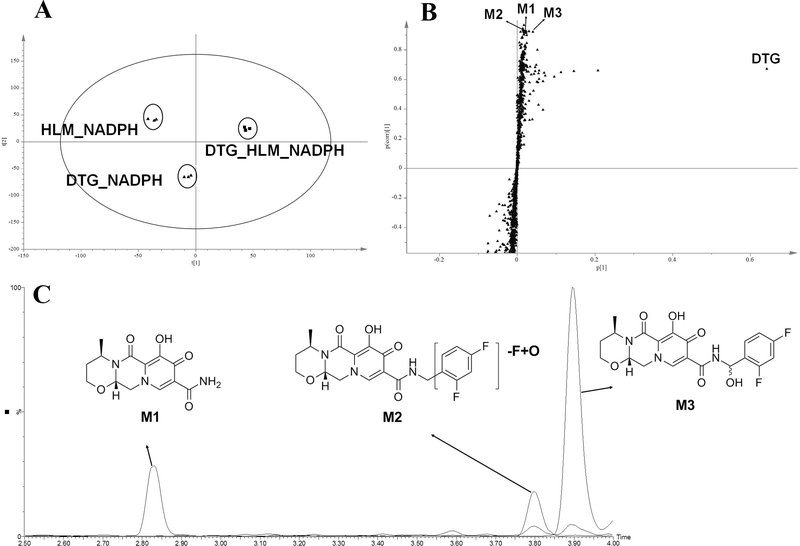
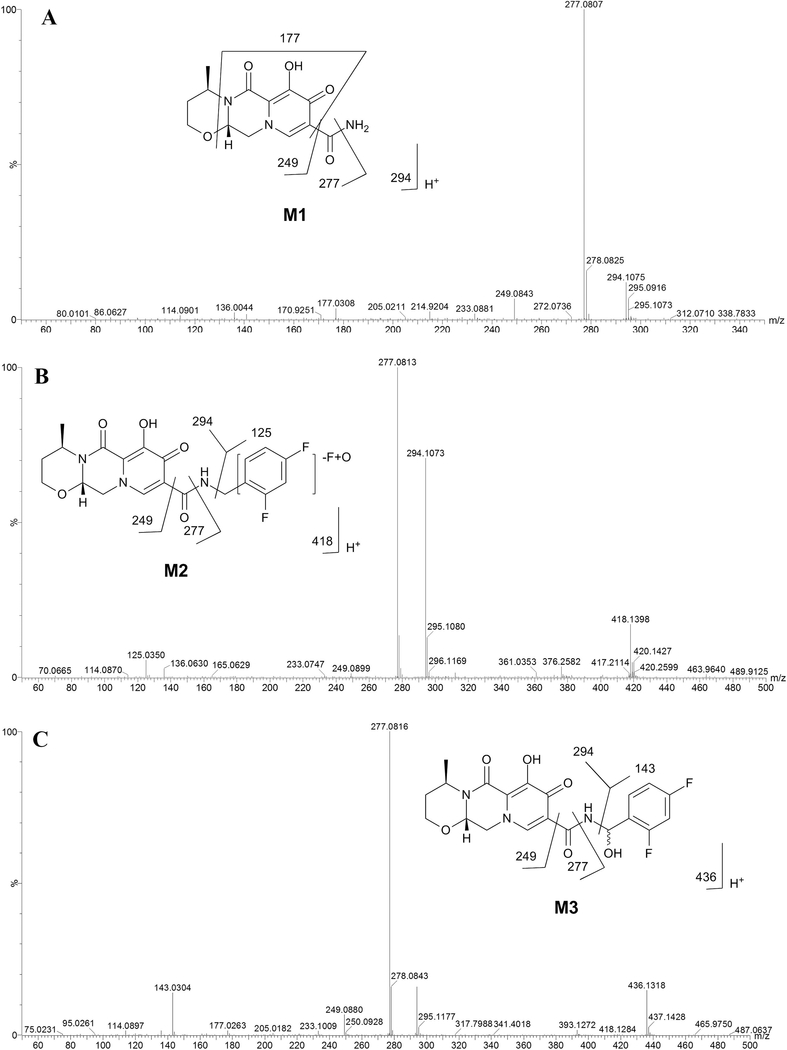
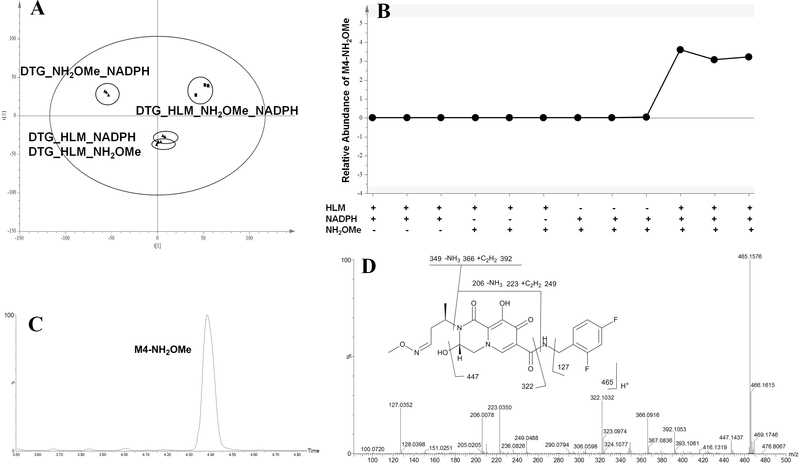
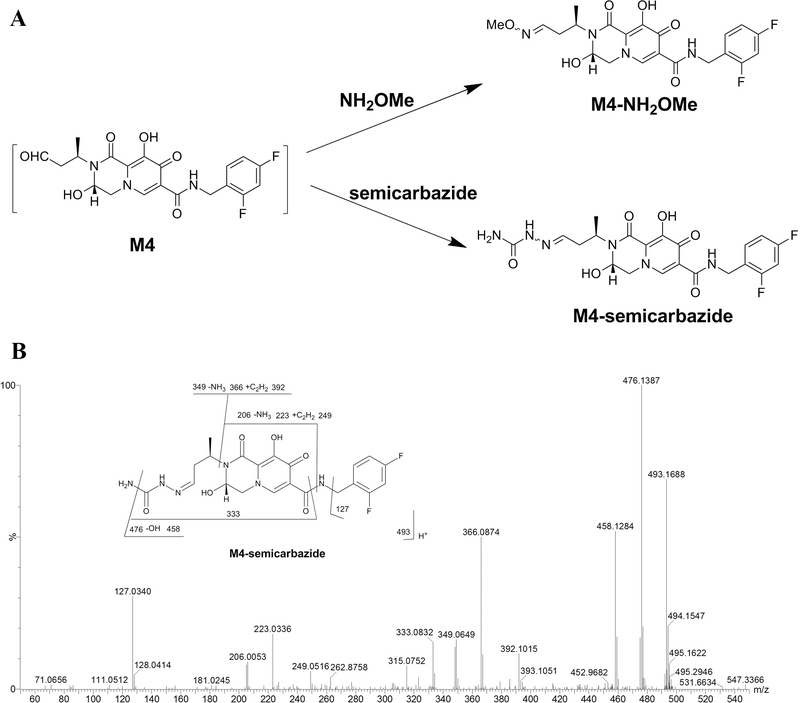
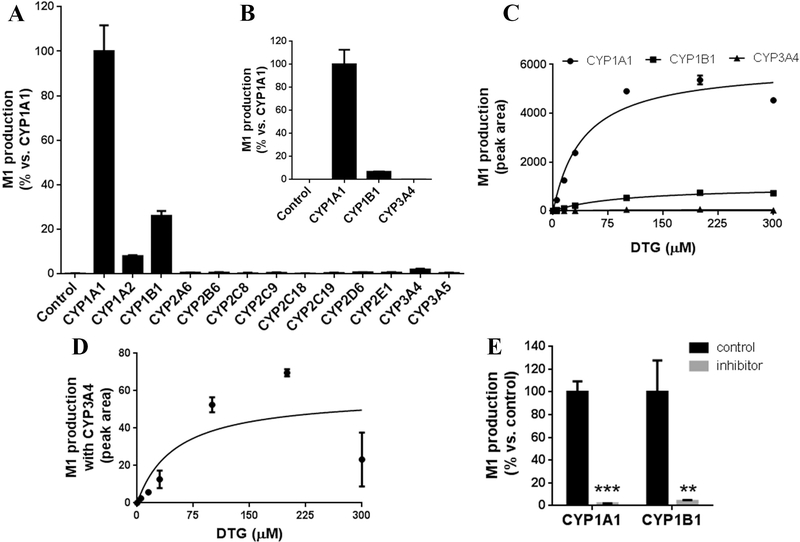
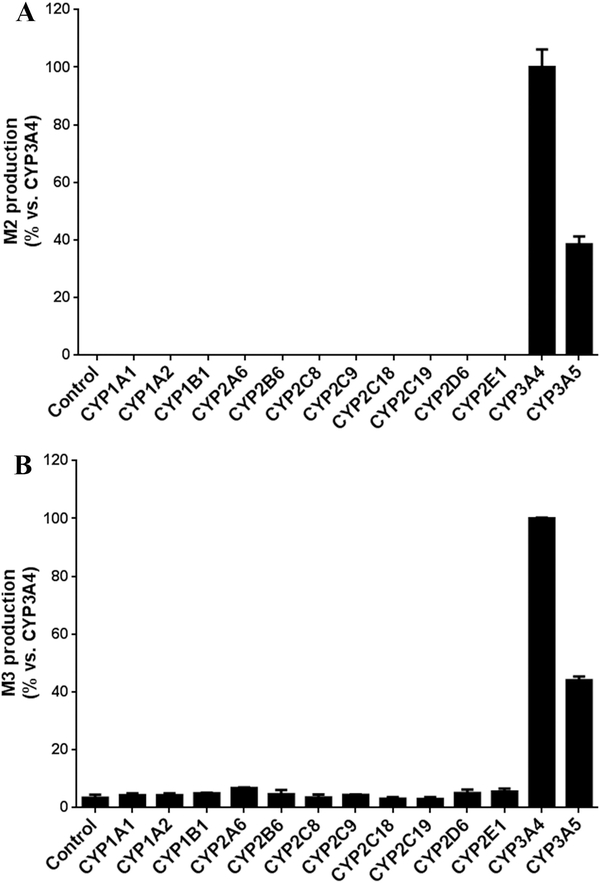
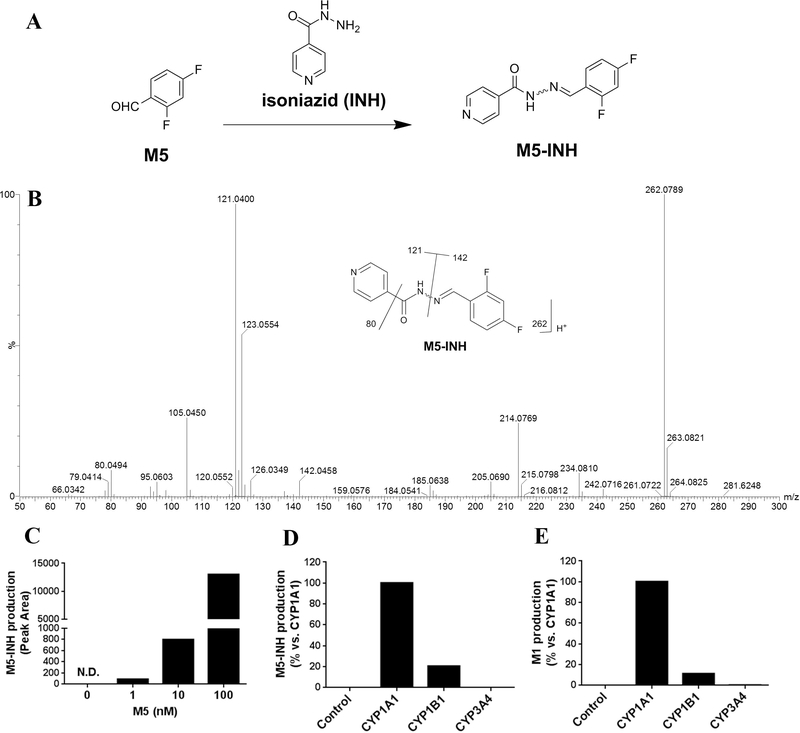
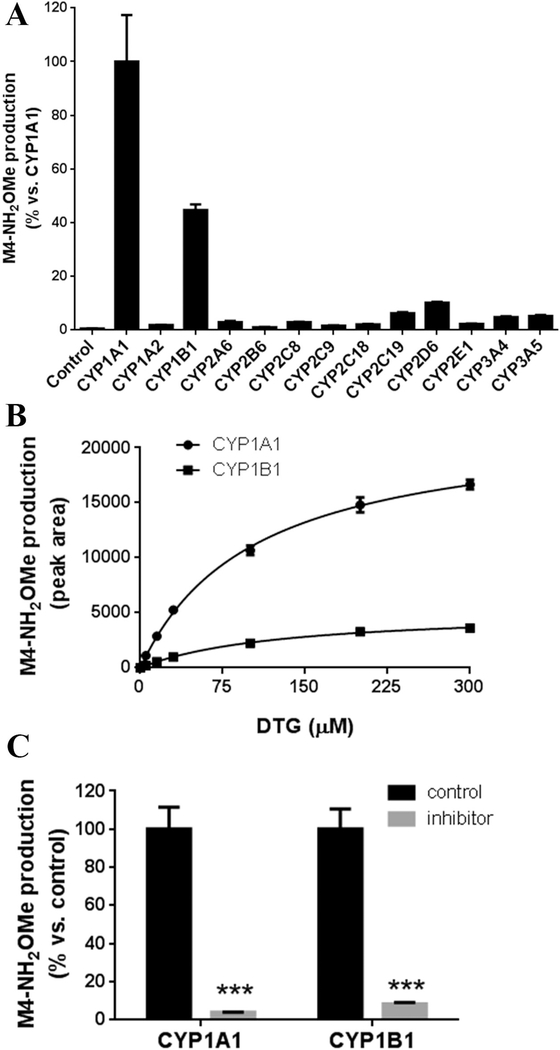
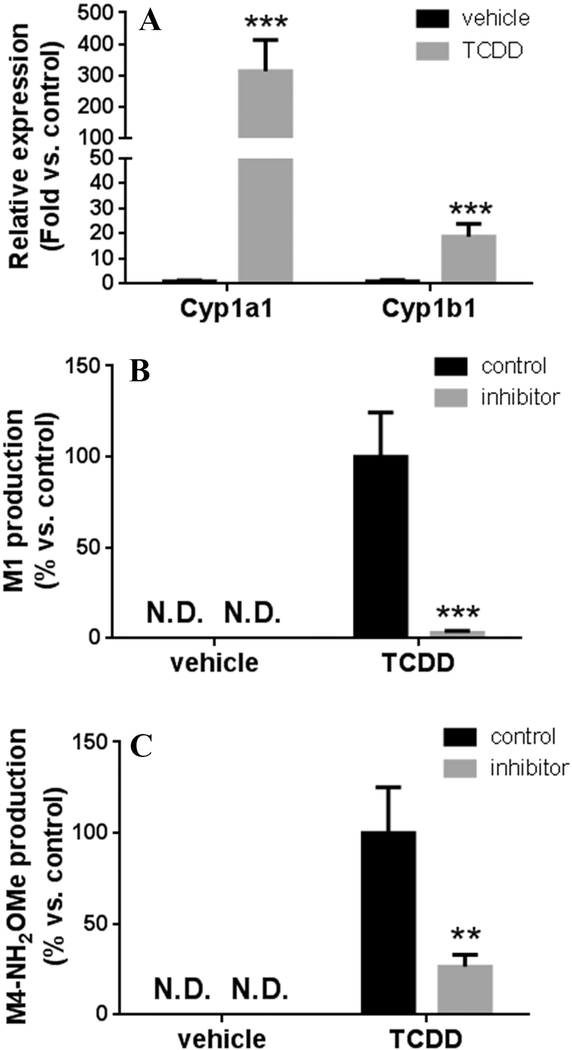
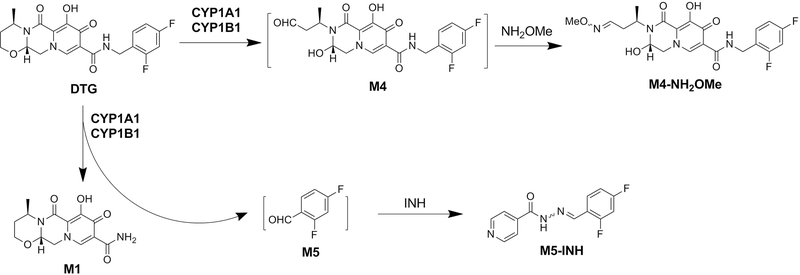
Dolutegravir (DTG), a potent integrase inhibitor, is part of a recommended initial regimen for the treatment of human immunodeficiency virus (HIV). Prior reports demonstrated that the clearance of DTG was higher in current smokers than non-smokers, but the mechanism remains unclear. Using a metabolomic approach, M4 (an aldehyde) was identified as a novel metabolite of DTG. In addition, the formation of M4 was found to be mediated by cytochrome P450 (CYP) 1A1 and 1B1, the enzymes that can be highly induced by cigarette smoking. CYP1A1 and 1B1 were also identified as the major enzymes contributing to the formation of M1 (an N-dealkylated metabolite of DTG) and M5 (an aldehyde). Furthermore, the production of M1 and M4 was significantly increased in the lung of mice treated with 2,3,7,8-tetrachlorodibenzo-p-dioxin, an inducer of CYP1A1 and 1B1. In summary, the current study uncovered the CYP1A1 and 1B1-mediated metabolic pathways of DTG. These data suggest that persons with HIV infection receiving DTG should be cautious to cigarettes, and drugs, or exposure to environmental chemicals that induce CYP1A1 and 1B1.
Keywords: CYP1A1; CYP1B1; Dolutegravir; HIV; Metabolism.
Copyright © 2018 Elsevier Inc. All rights reserved.
Conflict of interest statement
Conflict of interest
The authors declare that there are no conflicts of interest.
Figures
Similar articles
-
Relative effect potency estimates of dioxin-like activity for dioxins, furans, and dioxin-like PCBs in adults based on cytochrome P450 1A1 and 1B1 gene expression in blood.Environ Int. 2016 Nov;96:24-33. doi: 10.1016/j.envint.2016.08.016. Epub 2016 Aug 31. Environ Int. 2016. PMID: 27588699 Free PMC article.
-
Arylhydrocarbon receptor-dependent induction of liver and lung cytochromes P450 1A1, 1A2, and 1B1 by polycyclic aromatic hydrocarbons and polychlorinated biphenyls in genetically engineered C57BL/6J mice.Carcinogenesis. 2002 Jul;23(7):1199-207. doi: 10.1093/carcin/23.7.1199. Carcinogenesis. 2002. PMID: 12117779
-
Cytochrome P450 1A1 and 1B1 in human blood lymphocytes are not suitable as biomarkers of exposure to dioxin-like compounds: polymorphisms and interindividual variation in expression and inducibility.Toxicol Sci. 2005 May;85(1):703-12. doi: 10.1093/toxsci/kfi089. Epub 2005 Jan 19. Toxicol Sci. 2005. PMID: 15659568
-
The Activation of Procarcinogens by CYP1A1/1B1 and Related Chemo-Preventive Agents: A Review.Curr Cancer Drug Targets. 2021;21(1):21-54. doi: 10.2174/1568009620666201006143419. Curr Cancer Drug Targets. 2021. PMID: 33023449 Review.
-
[Mechanisms of action, pharmacology and interactions of dolutegravir].Enferm Infecc Microbiol Clin. 2015 Mar;33 Suppl 1:2-8. doi: 10.1016/S0213-005X(15)30002-1. Enferm Infecc Microbiol Clin. 2015. PMID: 25858605 Review. Spanish.
Cited by
-
Tandem mass spectrometry of small-molecule antiviral drugs: 1. HIV-related antivirals.Int J Mass Spectrom. 2020 Sep;455:116370. doi: 10.1016/j.ijms.2020.116370. Epub 2020 Jun 15. Int J Mass Spectrom. 2020. PMID: 33519296 Free PMC article. Review.
-
Bidirectional Associations among Nicotine and Tobacco Smoke, NeuroHIV, and Antiretroviral Therapy.J Neuroimmune Pharmacol. 2020 Dec;15(4):694-714. doi: 10.1007/s11481-019-09897-4. Epub 2019 Dec 13. J Neuroimmune Pharmacol. 2020. PMID: 31834620 Free PMC article. Review.
-
HIV, smoking, and the brain: a convergence of neurotoxicities.AIDS Res Ther. 2025 Feb 6;22(1):13. doi: 10.1186/s12981-025-00714-y. AIDS Res Ther. 2025. PMID: 39915881 Free PMC article. Review.
-
ABCG2 Deficiency Does Not Alter Dolutegravir Metabolism and Pharmacokinetics.J Pharmacol Exp Ther. 2020 Jul;374(1):38-43. doi: 10.1124/jpet.119.264424. Epub 2020 Apr 17. J Pharmacol Exp Ther. 2020. PMID: 32303561 Free PMC article.
-
An update on drug-drug interactions between antiretroviral therapies and drugs of abuse in HIV systems.Expert Opin Drug Metab Toxicol. 2020 Nov;16(11):1005-1018. doi: 10.1080/17425255.2020.1814737. Epub 2020 Aug 31. Expert Opin Drug Metab Toxicol. 2020. PMID: 32842791 Free PMC article. Review.
References
-
- Kobayashi M Yoshinaga T Seki T Wakasa-Morimoto C Brown KW Ferris R Foster SA Hazen RJ Miki S Suyama- Kagitani A Kawauchi-Miki S Taishi T Kawasuji T Johns BA Underwood MR Garvey EP Sato A Fujiwara T In Vitro antiretroviral properties of S/GSK1349572, a next-generation HIV integrase inhibitor Antimicrob. Agents Chemother. 55 2 2011. 813–821 - PMC - PubMed
-
- Eron JJ, Clotet B, Durant J, Katlama C, Kumar P, Lazzarin A, Poizot- Martin I, Richmond G, Soriano V, Ait-Khaled M, Fujiwara T, Huang J, Min S, Vavro C, Yeo J, Group VS, Safety and efficacy of dolutegravir in treatment- experienced subjects with raltegravir-resistant HIV type 1 infection: 24-week results of the VIKING Study, J. Infect. Dis 207(5) (2013) 740–748. - PMC - PubMed
-
- Hightower KE, Wang R, Deanda F, Johns BA, Weaver K, Shen Y, Tomberlin GH, Carter HL 3rd, Broderick T, Sigethy S, Seki T, Kobayashi M, Underwood MR, Dolutegravir (S/GSK1349572) exhibits significantly slower dissociation than raltegravir and elvitegravir from wild-type and integrase inhibitor-resistant HIV- 1 integrase-DNA complexes, Antimicrob. Agents Chemother 55(10) (2011) 4552–4559. - PMC - PubMed
-
- Kaplan R, Wood R, Resistance to first-line ART and a role for dolutegravir, The Lancet HIV 5 (2017) e112–e113. - PubMed
Publication types
MeSH terms
Substances
Grants and funding
LinkOut - more resources
Full Text Sources
