

Passive functional mapping of receptive language areas using electrocorticographic signals
- PMID: 30342252
- PMCID: PMC6414063
- DOI: 10.1016/j.clinph.2018.09.007
Passive functional mapping of receptive language areas using electrocorticographic signals
Abstract
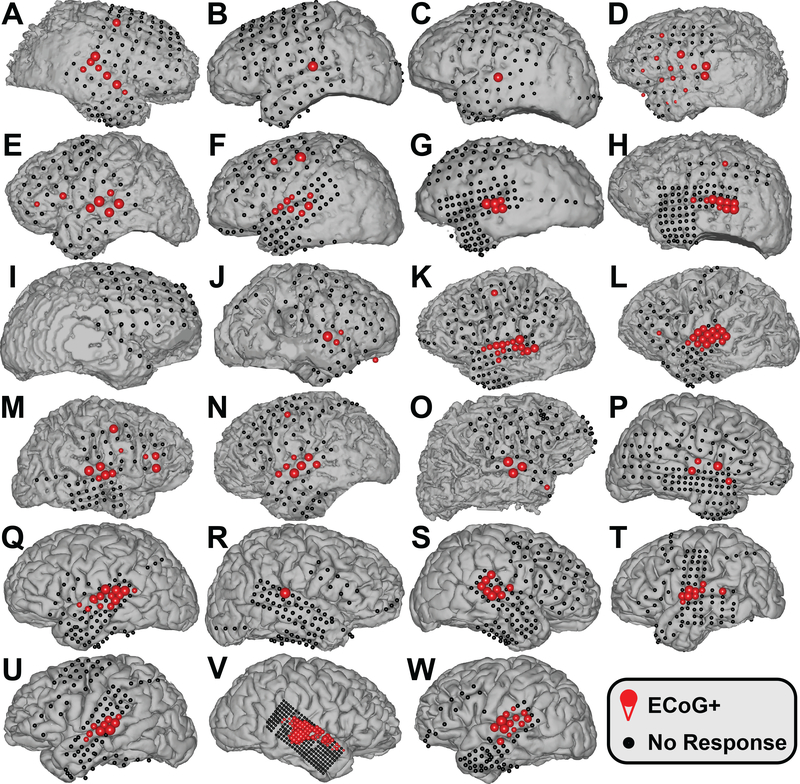
Objective: To validate the use of passive functional mapping using electrocorticographic (ECoG) broadband gamma signals for identifying receptive language cortex.
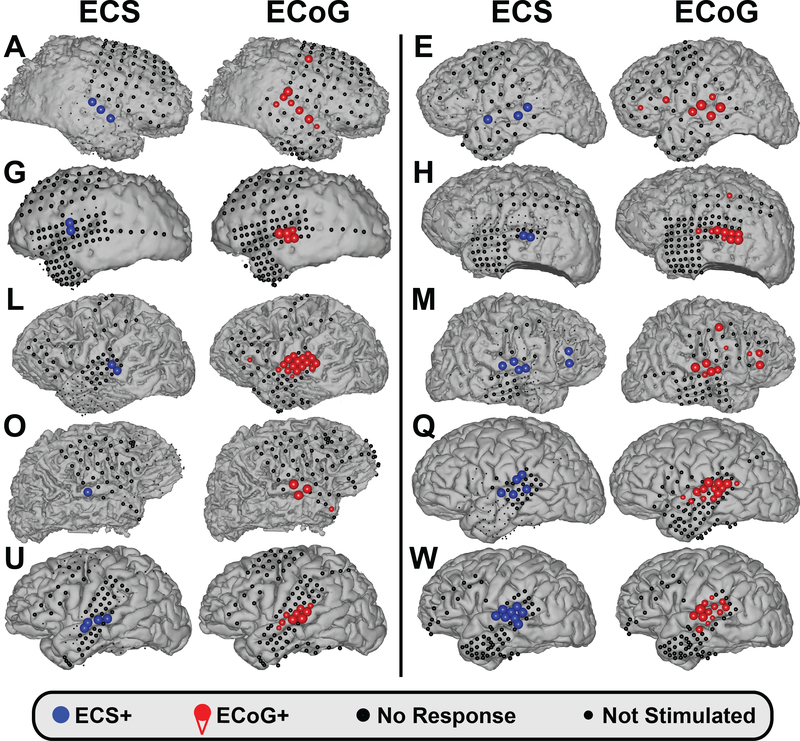
Methods: We mapped language function in 23 patients using ECoG and using electrical cortical stimulation (ECS) in a subset of 15 subjects.
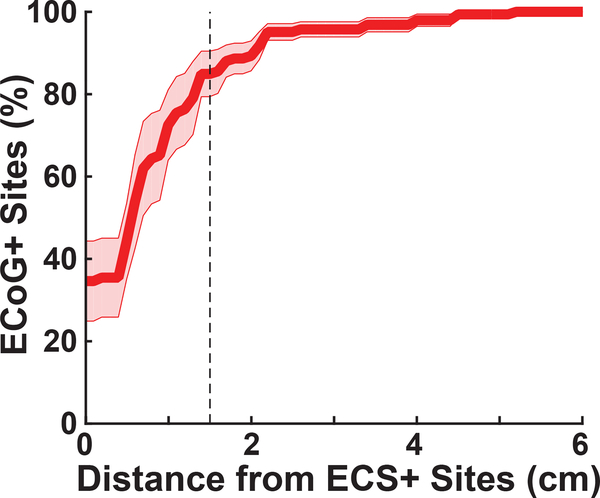
Results: The qualitative comparison between cortical sites identified by ECoG and ECS show a high concordance. A quantitative comparison indicates a high level of sensitivity (95%) and a lower level of specificity (59%). Detailed analysis reveals that 82% of all cortical sites identified by ECoG were within one contact of a site identified by ECS.
Conclusions: These results show that passive functional mapping reliably localizes receptive language areas, and that there is a substantial concordance between the ECoG- and ECS-based methods. They also point to a more refined understanding of the differences between ECoG- and ECS-based mappings. This refined understanding helps to clarify the instances in which the two methods disagree and can explain why neurosurgical practice has established the concept of a "safety margin."
Significance: Passive functional mapping using ECoG signals provides a fast, robust, and reliable method for identifying receptive language areas without many of the risks and limitations associated with ECS.
Keywords: ECoG; Electrocorticography; Functional mapping; Intracranial; Receptive language.
Copyright © 2018 International Federation of Clinical Neurophysiology. Published by Elsevier B.V. All rights reserved.
Conflict of interest statement
Conflict of Interest Statement
Mr. Swift was employed by g.tec during the time of this study, and was involved in developing cortiQ, a commercial tool for mapping of cortical function.
Dr. Coon was employed by g.tec during the time of this study, and was involved in developing cortiQ, a commercial tool for mapping of cortical function.
Dr. Guger is CEO of g.tec, which is developing cortiQ, a commercial tool for mapping cortical function.
Dr. Brunner holds intellectual property for brain mapping technologies, and may derive licensing income from the same.
Dr. Bunch reports no disclosures.
Dr. Lynch reports no disclosures.
Dr. Frawley reports no disclosures.
Dr. Ritaccio holds intellectual property for brain mapping technologies, and may derive licensing income from the same.
Dr. Schalk holds intellectual property for brain mapping technologies, and may derive licensing income from the same.
Figures
References
-
- Babajani-Feremi A, Narayana S, Rezaie R, Choudhri AF, Fulton SP, Boop FA, Wheless JW, Papanicolaou AC Language mapping using high gamma electrocorticography, fMRI, and TMS versus electrocortical stimulation. Clin Neurophysiol 2016;127(3):1822–1836. URL: 10.1016/j.clinph.2015.11.017. doi: 10.1016/j.clinph.2015.11.017. - DOI - PubMed
Publication types
MeSH terms
Grants and funding
LinkOut - more resources
Full Text Sources
