

How do we assess a racial disparity in health? Distribution, interaction, and interpretation in epidemiological studies
- PMID: 30342887
- PMCID: PMC6628690
- DOI: 10.1016/j.annepidem.2018.09.007
How do we assess a racial disparity in health? Distribution, interaction, and interpretation in epidemiological studies
Abstract
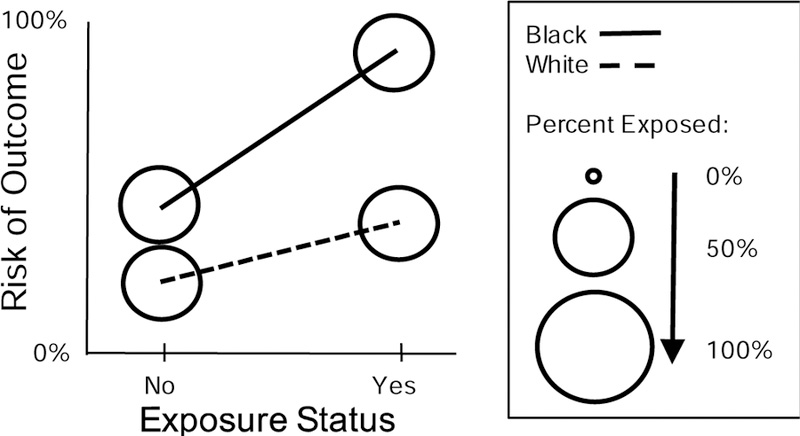
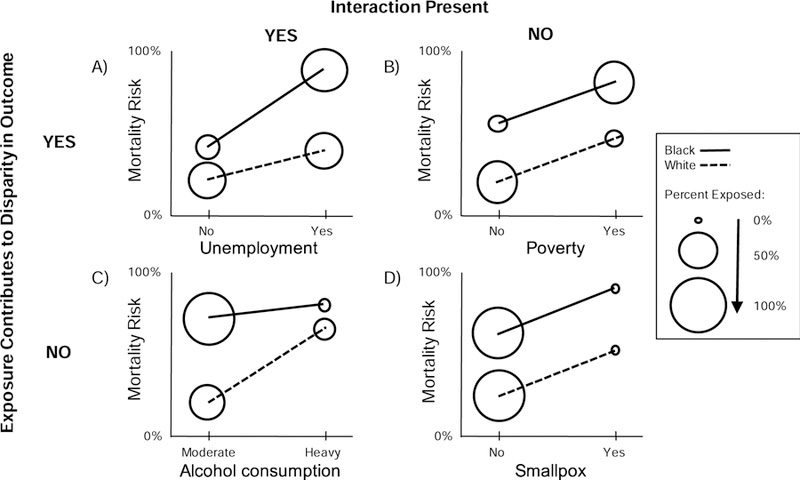
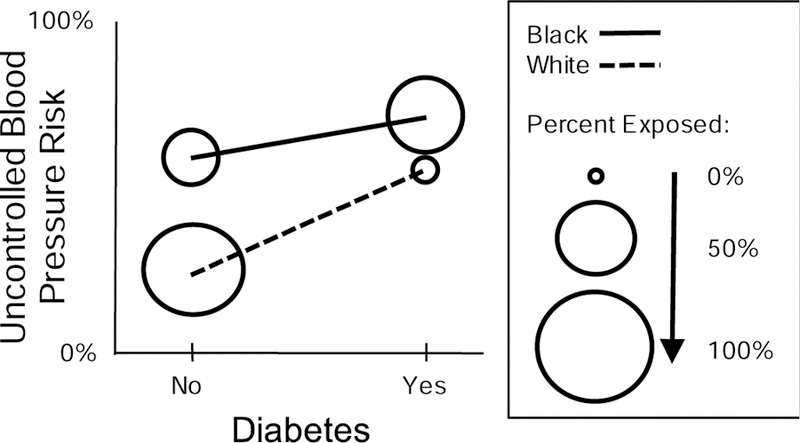
Identifying the exposures or interventions that exacerbate or ameliorate racial health disparities is one of the fundamental goals of social epidemiology. Introducing an interaction term between race and an exposure into a statistical model is commonly used in the epidemiologic literature to assess racial health disparities and the potential viability of a targeted health intervention. However, researchers may attribute too much authority to the interaction term and inadvertently ignore other salient information regarding the health disparity. In this article, we highlight empirical examples from the literature demonstrating limitations of overreliance on interaction terms in health disparities research; we further suggest approaches for moving beyond interaction terms when assessing these disparities. We promote a comprehensive framework of three guiding questions for disparity investigation, suggesting examination of the group-specific differences in (1) outcome prevalence, (2) exposure prevalence, and (3) effect size. Our framework allows for better assessment of meaningful differences in population health and the resulting implications for interventions, demonstrating that interaction terms alone do not provide sufficient means for determining how disparities arise. The widespread adoption of this more comprehensive approach has the potential to dramatically enhance understanding of the patterning of health and disease and the drivers of health disparities.
Keywords: Health disparities; Interaction; Interpretation; Modification; Race; Regression.
Copyright © 2018 The Authors. Published by Elsevier Inc. All rights reserved.
Figures
Similar articles
-
Health-related disparities: influence of environmental factors.Med Clin North Am. 2005 Jul;89(4):721-38. doi: 10.1016/j.mcna.2005.02.001. Med Clin North Am. 2005. PMID: 15925646 Review.
-
Explaining Racial Disparities in Child Asthma Readmission Using a Causal Inference Approach.JAMA Pediatr. 2016 Jul 1;170(7):695-703. doi: 10.1001/jamapediatrics.2016.0269. JAMA Pediatr. 2016. PMID: 27182793 Free PMC article.
-
Racial disparities in pediatric access to kidney transplantation: does socioeconomic status play a role?Am J Transplant. 2012 Feb;12(2):369-78. doi: 10.1111/j.1600-6143.2011.03888.x. Epub 2012 Jan 6. Am J Transplant. 2012. PMID: 22226039 Free PMC article.
-
Does race or ethnicity play a role in the origin, pathophysiology, and outcomes of preeclampsia? An expert review of the literature.Am J Obstet Gynecol. 2022 Feb;226(2S):S876-S885. doi: 10.1016/j.ajog.2020.07.038. Epub 2020 Jul 24. Am J Obstet Gynecol. 2022. PMID: 32717255 Review.
-
Does Universal Insurance and Access to Care Influence Disparities in Outcomes for Pediatric Patients with Osteomyelitis?Clin Orthop Relat Res. 2020 Jul;478(7):1432-1439. doi: 10.1097/CORR.0000000000000994. Clin Orthop Relat Res. 2020. PMID: 31725027 Free PMC article.
Cited by
-
The Identity Vitality-Pathology model: A novel theoretical framework proposing "identity state" as a modulator of the pathways from structural to health inequity.Soc Sci Med. 2022 Dec;314:115495. doi: 10.1016/j.socscimed.2022.115495. Epub 2022 Nov 1. Soc Sci Med. 2022. PMID: 36335704 Free PMC article. No abstract available.
-
The Association Between Educational Attainment and Mortality: Examining Absolute and Relative Effects by Race/Ethnicity.Ethn Dis. 2022 Jan 20;32(1):1-10. doi: 10.18865/ed.32.1.1. eCollection 2022 Winter. Ethn Dis. 2022. PMID: 35106039 Free PMC article.
-
Re-prioritizing traffic stops to reduce motor vehicle crash outcomes and racial disparities.Inj Epidemiol. 2020 Jan 20;7(1):3. doi: 10.1186/s40621-019-0227-6. Inj Epidemiol. 2020. PMID: 32127046 Free PMC article.
-
Unequal effects of disruptive events.Sociol Compass. 2022 Apr;16(4):e12972. doi: 10.1111/soc4.12972. Epub 2022 Feb 17. Sociol Compass. 2022. PMID: 38895138 Free PMC article.
-
Association of Regional White Matter Hyperintensities With Longitudinal Alzheimer-Like Pattern of Neurodegeneration in Older Adults.JAMA Netw Open. 2021 Oct 1;4(10):e2125166. doi: 10.1001/jamanetworkopen.2021.25166. JAMA Netw Open. 2021. PMID: 34609497 Free PMC article.
References
-
- CDC. Community Health and Program Services (CHAPS): Health Disparities Among Racial/Ethnic Populations Atlanta: 2008.
-
- Agency for Healthcare Research and Quality. 2015. National Healthcare Quality and Disparities Report and 5th Anniversary Update on the National Quality Strategy 2016;Publicatio.
Publication types
MeSH terms
Grants and funding
LinkOut - more resources
Full Text Sources
Other Literature Sources
Medical
