. 2018 Oct 20;6(1):42.
doi: 10.1186/s40635-018-0206-1.

Appraisal of systemic inflammation and diagnostic markers in a porcine model of VAP: secondary analysis from a study on novel preventive strategies

Affiliations

Appraisal of systemic inflammation and diagnostic markers in a porcine model of VAP: secondary analysis from a study on novel preventive strategies

Gianluigi Li Bassi et al. Intensive Care Med Exp. .

Abstract

Background: We previously evaluated the efficacy of a ventilatory strategy to achieve expiratory flow bias and positive end-expiratory pressure (EFB + PEEP) or the Trendelenburg position (TP) for the prevention of ventilator-associated pneumonia (VAP). These preventive measures were aimed at improving mucus clearance and reducing pulmonary aspiration of bacteria-laden oropharyngeal secretions. This secondary analysis is aimed at evaluating the effects of aforementioned interventions on systemic inflammation and to substantiate the value of clinical parameters and cytokines in the diagnosis of VAP.

Methods: Twenty female pigs were randomized to be positioned in the semirecumbent/prone position, and ventilated with duty cycle 0.33 and without PEEP (control); positioned as in the control group, PEEP 5 cmH2O, and duty cycle to achieve expiratory flow bias (EFB+PEEP); ventilated as in the control group, but in the Trendelenburg position (Trendelenburg). Following randomization, P. aeruginosa was instilled into the oropharynx. Systemic cytokines and tracheal secretions P. aeruginosa concentration were quantified every 24h. Lung biopsies were collected for microbiological confirmation of VAP.

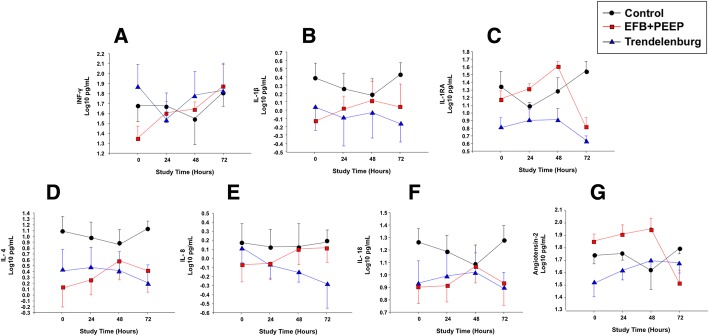
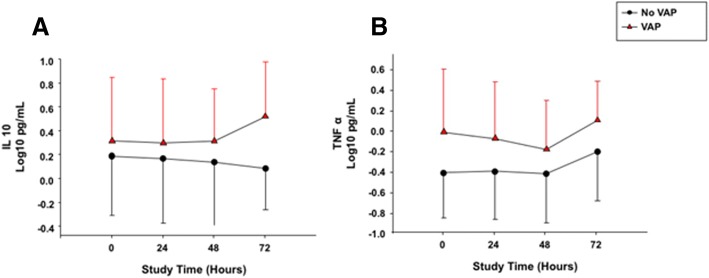
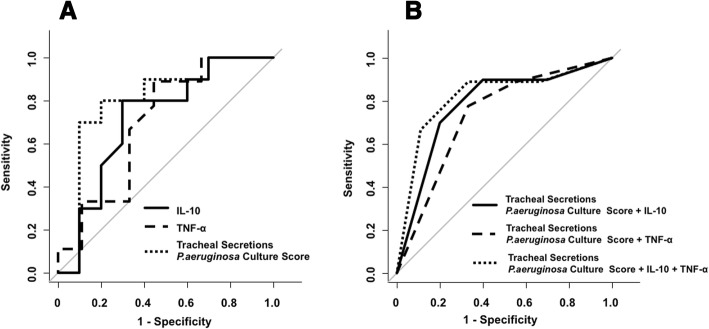
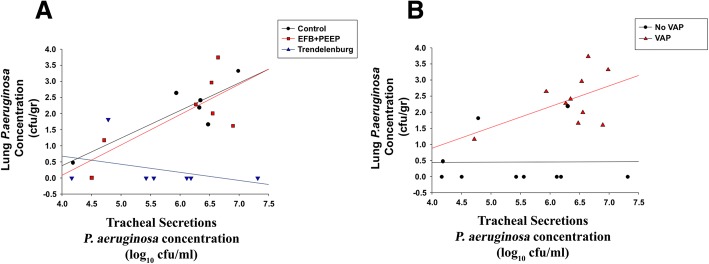
Results: In the control, EFB + PEEP, and Trendelenburg groups, lung tissue Pseudomonas aeruginosa concentration was 2.4 ± 1.5, 1.9 ± 2.1, and 0.3 ± 0.6 log cfu/mL, respectively (p = 0.020). Whereas, it was 2.4 ± 1.9 and 0.6 ± 0.9 log cfu/mL in animals with or without VAP (p < 0.001). Lower levels of interleukin (IL)-1β (p = 0.021), IL-1RA (p < 0.001), IL-4 (p = 0.005), IL-8 (p = 0.008), and IL-18 (p = 0.050) were found in Trendelenburg animals. VAP increased IL-10 (p = 0.035), tumor necrosis factor-α (p = 0.041), and endotracheal aspirate (ETA) P. aeruginosa concentration (p = 0.024). A model comprising ETA bacterial burden, IL-10, and TNF-α yielded moderate discrimination for the diagnosis of VAP (area of the receiver operating curve 0.82, 95% CI 0.61-1.00).

Conclusions: Our findings demonstrate anti-inflammatory effects associated with the Trendelenburg position. In this reliable model of VAP, ETA culture showed good diagnostic accuracy, whereas systemic IL-10 and TNF-α marginally improved accuracy. Further clinical studies will be necessary to confirm clinical value of the Trendelenburg position as a measure to hinder inflammation during mechanical ventilation and significance of systemic IL-10 and TNF-α in the diagnosis of VAP.

Keywords: Inflammation; Interleukin; Mechanical ventilation; Semirecumbent; Trendelenburg; Ventilator-associated pneumonia.


Conflict of interest statement

Ethics approval and consent to participate

The Institutional Ethics Committee evaluated and approved our study protocol: Dr. Jordi Alberch Vie; Álvaro Gimeno Sandig; Raquel Corral Vistué; Dr. Garikoitz Azkona Mendoza; Dr. Victor Fernández Dueñas; Dr. Jordi Guinea Mejías; Dr. Francesc López Soriano; Dr. Carmen Navarro Aragay; Dr. Francisco José Pérez Can; Dr. Montserrat Rigol Muixart; and Dr. Teresa Rodrigo Calduch.

Consent for publication

Not applicable.

Competing interests

The authors declare that they have no competing interests.

Publisher’s Note

Springer Nature remains neutral with regard to jurisdictional claims in published maps and institutional affiliations.

Figures

Fig. 1
Fig. 1
Cytokines that significantly differed among study treatments, per times of assessment. a IFN-γ differed among study treatments (p = 0.043); no differences were found among times of assessment (p = 0.470) and study treatments × times of assessment (p = 0.847). b IL-1ß differed among study treatments (p = 0.038); whereas, we did not find differences among times of assessment (p = 0.869) and study treatments × times of assessment (p = 0.973). c IL-1RA differed among study treatments (p < 0.001); whereas, we did not find differences among times of assessment (p = 0.151) and study treatments × times of assessment (p = 0.618). d IL-4 differed among study treatments (p = 0.064); no differences among times of assessment (p = 0.861) and study treatments × times of assessment (p = 0.967) were found. e IL-8 differed among study treatments (p = 0.066) and no differences among times of assessment (p = 0.915) and study treatments × times of assessment (p = 0.978) were found. f IL-18 differed among study treatments (p = 0.005); whereas, among times of assessment (p = 0.879), and study treatments × times of assessment (p = 0.991) no differences were found. g Angiotensin-2 differed among study treatments (p = 0.048); whereas, among times of assessment (p = 0.552), and study treatments × times of assessment (p = 0.949) no differences were found. IFN interferon, IL interleukin, EFB + PEEP expiratory flow bias and positive end-expiratory pressure group
Fig. 2
Fig. 2
Cytokines that significantly differed between animals with or without VAP, per times of assessment. a IL-10 differed among animals with or without VAP (p = 0.028) and for occurrence of VAP × study treatments (p = 0.029); whereas, among times of assessment (p = 0.984) and occurrence of VAP × times of assessment (p = 0.999) no differences were found. b TNF differed among types of pulmonary infection (p = 0.003) and study treatments (p = 0.008); whereas, among types of pulmonary infection × study treatments (p = 0.007); times of assessment (p = 0.984) and types of pulmonary infection × times of assessment (p = 0.995) no differences were found. IFN-γ interferon-γ, IL interleukin
Fig. 3
Fig. 3
Analysis of the receiver operating characteristics curves. a Analysis of the receiver operating characteristic curve for IL-10, TNF-α, and the tracheal secretions P. aeruginosa concentration score, which was computed as follows: 0 = < 3.0 log10 cfu/mL; 1 = 3.0–3.9 log10 cfu/mL; 2 = 4.0–4.9 log10 cfu/mL; 3 = 5–5.9 log10 cfu/mL; 4 = ≥ 6 log10 cfu/mL. The area under the receiver operating characteristics curves of IL-10, TNF-α, and the tracheal secretions P. aeruginosa concentration score were 0.71, 0.69, and 0.81, respectively. b Analysis of the receiver operating characteristic curve for tracheal secretions P. aeruginosa concentration score with IL10, TNF-α, or IL10 and TNF-α. The area under the receiver operating characteristics curves of tracheal secretions P. aeruginosa concentration score with IL10 was 0.78, of tracheal secretions P. aeruginosa concentration score with TNF-α was 0.73, and of tracheal secretions P. aeruginosa concentration score with IL-10 and TNF-α was 0.82. We did not find any statistically significant differences among the tested receiver operating characteristics curves
Fig. 4
Fig. 4
Lung P. aeruginosa burden as a function of tracheal secretions P. aeruginosa burden. a The linear regression equation was fitted to predict lung P. aeruginosa burden by tracheal secretions P. aeruginosa burden (log10 cfu/mL) and clustered by study groups. Regression equation control group: [lung P. aeruginosa burden (log10 cfu/g) = − 3.06 + (0.85 × tracheal secretions P. aeruginosa burden (log10 cfu/mL)]. N = 6, R = 0.85, R2 = 0.73, Adjusted Rsqr = 0.67, p value = 0.029. Regression equation EFB + PEEP group: [lung P. aeruginosa burden (log10 cfu/g) = − 3.68 + (0.94 × tracheal secretions P. aeruginosa burden (log10 cfu/mL)]. N = 7, R = 0.76, R2 = 0.57, Adjusted Rsqr = 0.49, p value = 0.048. Regression equation Trendelenburg group: [lung P. aeruginosa burden (log10 cfu/g) = − 1.67 + (− 0.25 × tracheal secretions P. aeruginosa burden (log10 cfu/mL)]. N = 7, R = 0.37, R2 = 0.14, Adjusted Rsqr = 0.00, p value = 0.411. b The linear regression equation was fitted to predict lung P. aeruginosa burden by tracheal secretions P. aeruginosa burden (log10 cfu/mL) and clustered by development of ventilator-associated pneumonia (VAP). Regression equation VAP: [lung P. aeruginosa burden (log10 cfu/g) = − 1.69 + (0.64 × tracheal secretions P. aeruginosa burden (log10 cfu/mL)]. N = 10, R = 0.51, R2 = 0.26, Adjusted Rsqr = 0.17, p value = 0.130. Regression equation no VAP: [lung P. aeruginosa burden (log10 cfu/g) = 0.41 + (0.007 × tracheal secretions P. aeruginosa burden (log10 cfu/mL)]. N = 10, R = 0.01, R2 = 0.00, Adjusted Rsqr = 0.00, p value = 0.980. EFB + PEEP expiratory flow bias and positive end expiratory pressure group

Similar articles

Cited by

References

    1. Fihman V, Messika J, Hajage D, et al. Five-year trends for ventilator-associated pneumonia: correlation between microbiological findings and antimicrobial drug consumption. Int J Antimicrob Agents. 2015;46:518–525. doi: 10.1016/j.ijantimicag.2015.07.010. - DOI - PubMed
    1. Kalil AC, Metersky ML, Klompas M, et al. Management of adults with hospital-acquired and ventilator-associated pneumonia: 2016 clinical practice guidelines by the Infectious Diseases Society of America and the American Thoracic Society. Clin Infect Dis. 2016;63:e61–e111. doi: 10.1093/cid/ciw353. - DOI - PMC - PubMed
    1. Torres Antoni, Niederman Michael S., Chastre Jean, Ewig Santiago, Fernandez-Vandellos Patricia, Hanberger Hakan, Kollef Marin, Li Bassi Gianluigi, Luna Carlos M., Martin-Loeches Ignacio, Paiva J. Artur, Read Robert C., Rigau David, Timsit Jean François, Welte Tobias, Wunderink Richard. International ERS/ESICM/ESCMID/ALAT guidelines for the management of hospital-acquired pneumonia and ventilator-associated pneumonia. European Respiratory Journal. 2017;50(3):1700582. doi: 10.1183/13993003.00582-2017. - DOI - PubMed
    1. Bonten MJ, Froon AH, Gaillard CA, et al. The systemic inflammatory response in the development of ventilator-associated pneumonia. Am J Respir Crit Care Med. 1997;156:1105–1113. doi: 10.1164/ajrccm.156.4.9610002. - DOI - PubMed
    1. Hillas G, Vassilakopoulos T, Plantza P, et al. C-reactive protein and procalcitonin as predictors of survival and septic shock in ventilator-associated pneumonia. Eur Respir J. 2010;35:805–811. doi: 10.1183/09031936.00051309. - DOI - PubMed

LinkOut - more resources