. 2018 Oct 22;19(Suppl 11):363.
doi: 10.1186/s12859-018-2330-z.

outbreaker2: a modular platform for outbreak reconstruction

Affiliations

outbreaker2: a modular platform for outbreak reconstruction

Finlay Campbell et al. BMC Bioinformatics. .

Abstract

Background: Reconstructing individual transmission events in an infectious disease outbreak can provide valuable information and help inform infection control policy. Recent years have seen considerable progress in the development of methodologies for reconstructing transmission chains using both epidemiological and genetic data. However, only a few of these methods have been implemented in software packages, and with little consideration for customisability and interoperability. Users are therefore limited to a small number of alternatives, incompatible tools with fixed functionality, or forced to develop their own algorithms at considerable personal effort.

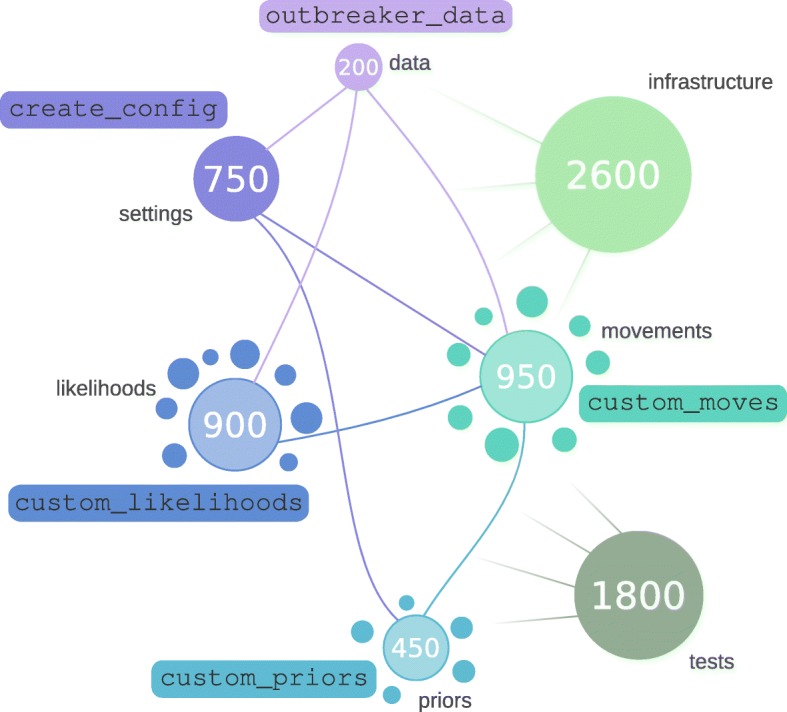
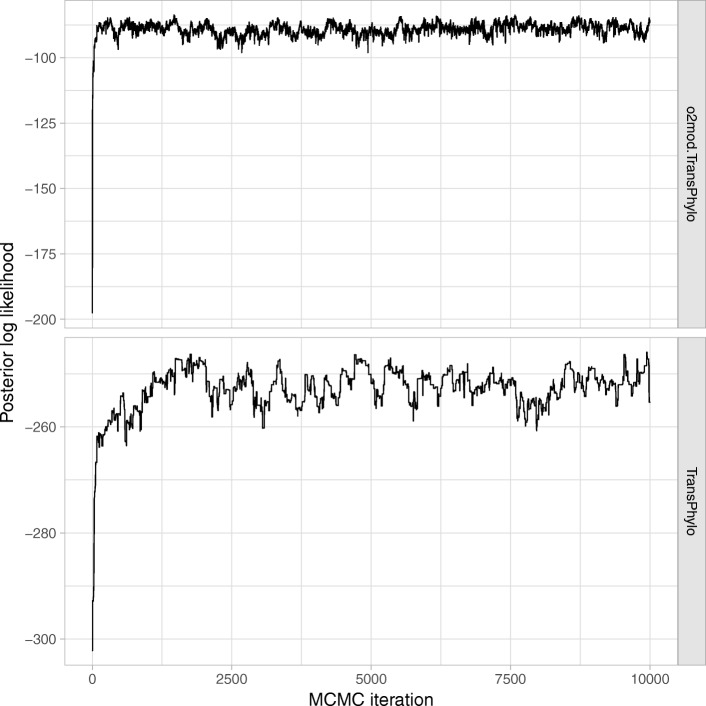
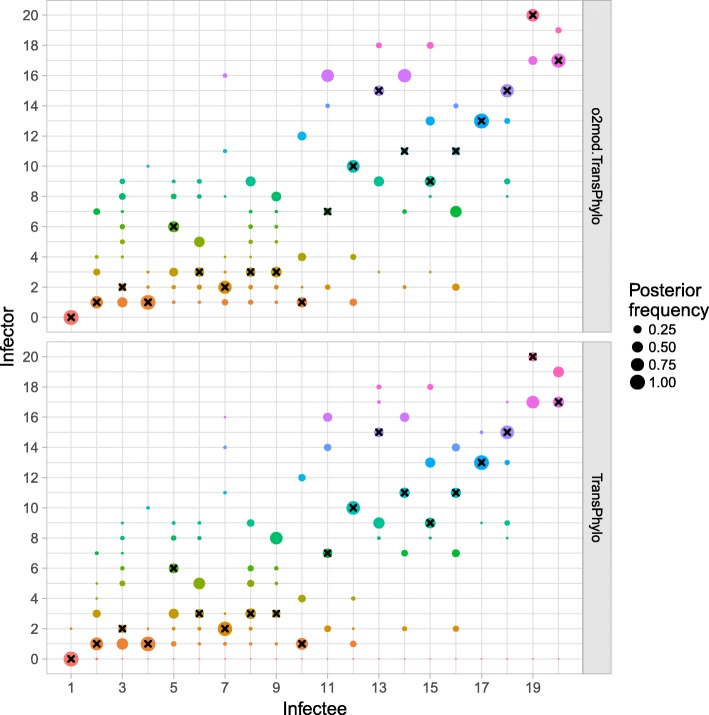
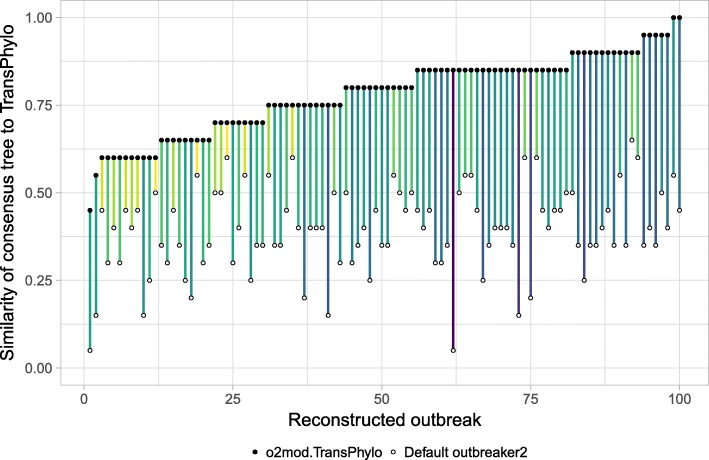
Results: Here we present outbreaker2, a flexible framework for outbreak reconstruction. This R package re-implements and extends the original model introduced with outbreaker, but most importantly also provides a modular platform allowing users to specify custom models within an optimised inferential framework. As a proof of concept, we implement the within-host evolutionary model introduced with TransPhylo, which is very distinct from the original genetic model in outbreaker, and demonstrate how even complex model results can be successfully included with minimal effort.

Conclusions: outbreaker2 provides a valuable starting point for future outbreak reconstruction tools, and represents a unifying platform that promotes customisability and interoperability. Implemented in the R software, outbreaker2 joins a growing body of tools for outbreak analysis.

Keywords: Bayesian; Chain; Epidemics; Genomics; Likelihood; MCMC; Software; Transmission; Tree.


Conflict of interest statement

Ethics approval and consent to participate

Not applicable.

Consent for publication

Not applicable.

Competing interests

The authors declare that they have no competing interests.

Publisher’s Note

Springer Nature remains neutral with regard to jurisdictional claims in published maps and institutional affiliations.

Figures

Fig. 1
Fig. 1
Schematic representation of the code design of outbreaker2. Each disk represents a different component of the code. Disk size matches the size of the corresponding component, indicated by numbers (in lines of code, rounded to 50). Separate disks for likelihoods, priors and movements indicate independent C++ modules. Links represent flows of information between components, colored according to the input. Infrastructure and tests are globally connected to all components. Functions indicated within rectangles are entry points into the code, indicating possible customisation by the user
Fig. 2
Fig. 2
MCMC traces of posterior likelihood for o2mod.TransPhylo and the original TransPhylo package
Fig. 3
Fig. 3
Posterior distribution of ancestry assignments using o2mod.TransPhylo and the original TransPhylo package. The size of each circle indicates the frequency of a given individual (“infector”) in the posterior distribution of infectors for a given case (“infectee”). An infector of 0 (bottom row) indicates that the individual is the index case. Black crosses represent the true simulated ancestries
Fig. 4
Fig. 4
Similarity of consensus trees inferred by o2mod.TransPhylo and outbreaker2 compared to TransPhylo. The consensus tree of a reconstructed outbreak is defined as the tree with the ancestor of the highest posterior probability for each case. The similarity between consensus trees is calculated as the proportion of identically assigned ancestries. The x-axis indicates individual simulated outbreaks. Each outbreak was reconstructed once using the default outbreaker2 model (white dots), and once using o2mod.TransPhylo (black dots). The colour of the line represents the change in similarity to the consensus tree returned by the original TransPhylo package

References

    1. Faye O, Boëlle P-Y, Heleze E, Faye O, Loucoubar C, Magassouba N, et al. Chains of transmission and control of Ebola virus disease in Conakry, Guinea, in 2014: an observational study. Lancet Infect Dis. 2015;15:320–326. doi: 10.1016/S1473-3099(14)71075-8. - DOI - PMC - PubMed
    1. Lloyd-Smith JO, Schreiber SJ, Kopp PE, Getz WM. Superspreading and the effect of individual variation on disease emergence. Nature. 2005;438:355–359. doi: 10.1038/nature04153. - DOI - PMC - PubMed
    1. Althaus CL. Ebola superspreading. Lancet Infect Dis. 2015;15:507–508. doi: 10.1016/S1473-3099(15)70135-0. - DOI - PMC - PubMed
    1. Ferguson NM, Donnelly CA, Anderson RM. Transmission intensity and impact of control policies on the foot and mouth epidemic in Great Britain. Nature. 2001;413:542–548. doi: 10.1038/35097116. - DOI - PubMed
    1. Wallinga J, Teunis P. Different epidemic curves for severe acute respiratory syndrome reveal similar impacts of control measures. Am J Epidemiol. 2004;160:509–516. doi: 10.1093/aje/kwh255. - DOI - PMC - PubMed