. 2018 Oct 22;19(1):161.
doi: 10.1186/s13059-018-1547-5.

SCoPE-MS: mass spectrometry of single mammalian cells quantifies proteome heterogeneity during cell differentiation

Affiliations

SCoPE-MS: mass spectrometry of single mammalian cells quantifies proteome heterogeneity during cell differentiation

Bogdan Budnik et al. Genome Biol. .

Abstract

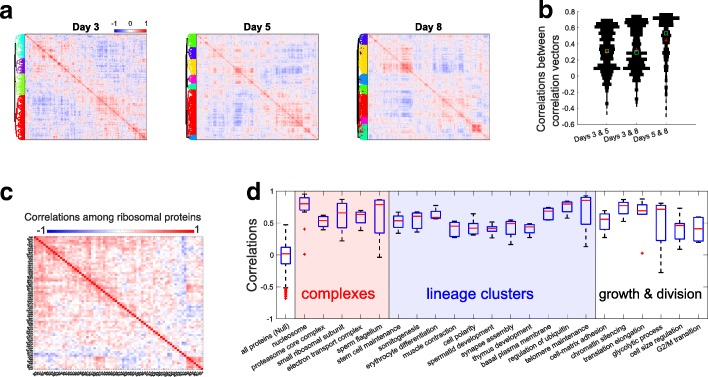
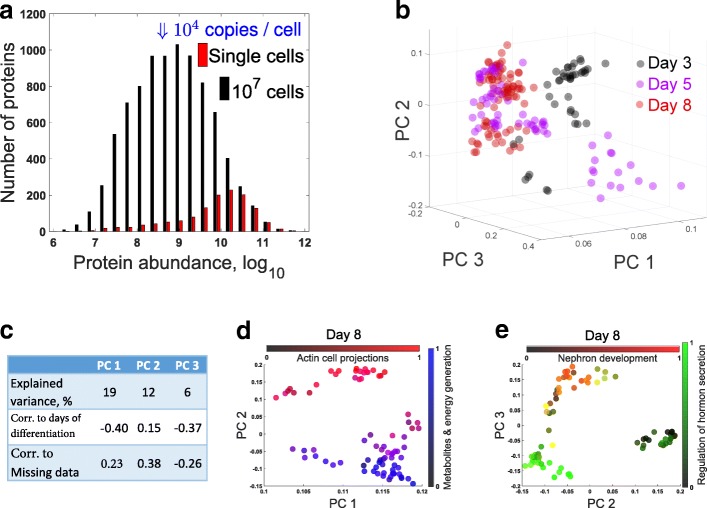
Some exciting biological questions require quantifying thousands of proteins in single cells. To achieve this goal, we develop Single Cell ProtEomics by Mass Spectrometry (SCoPE-MS) and validate its ability to identify distinct human cancer cell types based on their proteomes. We use SCoPE-MS to quantify over a thousand proteins in differentiating mouse embryonic stem cells. The single-cell proteomes enable us to deconstruct cell populations and infer protein abundance relationships. Comparison between single-cell proteomes and transcriptomes indicates coordinated mRNA and protein covariation, yet many genes exhibit functionally concerted and distinct regulatory patterns at the mRNA and the protein level.


Conflict of interest statement

Ethics approval and consent to participate

Ethics approvals were not needed for the study.

Consent for publication

Not applicable

Competing interests

The authors have filed a provisional patent on the entire protocol, application number: 62/618,301. The method is freely available for research and all other non-commercial purposes.

Publisher’s Note

Springer Nature remains neutral with regard to jurisdictional claims in published maps and institutional affiliations.

Figures

Fig. 1
Fig. 1
Validating SCoPE-MS by classifying single cancer cells based on their proteomes. a Conceptual diagram and work flow of SCoPE-MS. Individually picked live cells are lysed by sonication, the proteins in the lysates are digested with trypsin, the resulting peptides labeled with TMT labels, combined and analyzed by LC-MS/MS (Orbitrap Elite). b Design of control experiments used to test the ability of SCoPE-MS to distinguish U-937 cells from Jurkat cells. Each set was prepared and quantified on a different day to evaluate day-to-day batch artifacts. c Unsupervised principal component (PC) analysis using data for quantified proteins from the experiments described in panel b stratifies the proteomes of single cancer cells by cell type. Protein levels from six bulk samples from Jurkat and U-937 cells are also projected and marked with filled semitransparent circles. The two largest PCs explain over 50% of the variance. Similar separation of Jurkat and U-937 cells is observed when different carrier cells are used (Additional file 1: Figure S2). d Distributions of protein levels across single U-937 and Jurkat cells indicate cell-type-specific protein abundances. e Adenocarcinoma cells (MDA-MB-231) expressing mCherry and LifeAct-iRFP670 were sorted by Aria FACS into a 96-well plate, one cell per well. The relative levels of mCherry and iRFP were estimated by the sorter (from their florescence intensity) and by SCoPE-MS, and the two estimates compared by their Spearman correlations (ρ)
Fig. 2
Fig. 2
Identifying protein covariation across differentiating ES cells. a Clustergrams of pairwise protein-protein correlations in cells differentiating for 3, 5, and 8 days after LIF withdrawal. The correlation vectors were hierarchically clustered based on the cosine of the angles between them. All single-cell sets used the same carrier channel which was comprised of cells mixed from different time points. b The similarity between the correlation matrices shown in panel a is quantified by the distribution of correlations between corresponding correlation vectors, as we previously described [42]. Medians are marked with green squares and means with red pluses. c All pairwise Pearson correlations between ribosomal proteins (RPs) were computed by averaging across cells. The correlation matrix was clustered, using the cosine between the correlation vectors as a similar measure. d To evaluate the similarity in the relative levels of functionally related proteins, we computed the Pearson correlations within sets of functionally related proteins as defined by the gene ontology (GO). These sets included protein complexes, lineage-specific proteins, and proteins functioning in cell growth and division. The distribution of correlations for all quantified proteins is also displayed and used as a null distribution. To remove a positive bias from the null distribution, we subtracted the contribution of the first pair of singular vectors from the matrix of protein levels since this pair often concentrates global effects, which include batch effects and other system-wide trends [42, 54]. The difference between the distributions of correlations for the protein clusters and the null distribution is present in the raw data before this normalization
Fig. 3
Fig. 3
Principal component analysis of differentiating ES cells. a Distributions of protein abundances for all proteins quantified from 107 differentiating ES cells [17] or in at least one single-cell SCoPE-MS set at FDR 1%. The probability of quantifying a protein by SCoPE-MS is close to 100% for the most abundant proteins quantified in bulk samples and decreases with protein abundance, for a total of 1526 quantified proteins. b The proteomes of all single EB cells were projected onto their PCs, and the marker of each cell color-coded by day. The single-cell proteomes cluster partially based on the days of differentiation. c A tabular display of the variance explained by the principal components from panel c and their correlations to the days of differentiation and the missing data points for each cell. d, e The proteomes of cells differentiating for 8 days were projected onto their PCs, and the marker of each cell color-coded based on the normalized levels of all proteins from the indicated gene-ontology groups
Fig. 4
Fig. 4
Coordinated mRNA and protein covariation in differentiating ES cells. a Clustergram of pairwise correlations between mRNAs with 2.5 or more reads per cell as quantified by inDrop in single EB cells [47]. b Clustergram of pairwise correlations between proteins quantified by SCoPE-MS in 12 or more single EB cells. c The overlap between corresponding RNA from a and protein clusters from b indicates similar clustering patterns. d Protein-protein correlations correlate to their corresponding mRNA-mRNA correlations. Only genes with significant mRNA-mRNA correlations were used for this analysis. e The concordance between corresponding mRNA and protein correlations (computed as the correlation between corresponding correlations [42]) is high for ribosomal proteins (RPL and RPS) and lower for developmental genes; distribution medians are marked with red pluses. Only the subset of genes quantified at both RNA and protein levels were used for all panels

References

    1. Dean M, Fojo T, Bates S. Tumour stem cells and drug resistance. Nat Rev Cancer. 2005;5(4):275–284. doi: 10.1038/nrc1590. - DOI - PubMed
    1. Cohen AA, Geva-Zatorsky N, Eden E, Frenkel-Morgenstern M, Issaeva I, Sigal A, et al. Dynamic proteomics of individual cancer cells in response to a drug. Science. 2008;322(5907):1511–1516. doi: 10.1126/science.1160165. - DOI - PubMed
    1. Semrau S, van Oudenaarden A. Studying lineage decision-making in vitro: emerging concepts and novel tools. Annu Rev Cell Dev Biol. 2015;31:317–345. doi: 10.1146/annurev-cellbio-100814-125300. - DOI - PubMed
    1. Symmons O, Raj A. Whats luck got to do with it: single cells, multiple fates, and biological nondeterminism. Mol Cell. 2016;62(5):788–802. doi: 10.1016/j.molcel.2016.05.023. - DOI - PMC - PubMed
    1. Levy E, Slavov N. Single cell protein analysis for systems biology. Essays Biochem. 2018;62. 10.1042/EBC20180014. - PMC - PubMed

Publication types

LinkOut - more resources