. 2018 Nov 15;175(5):1380-1392.e14.
doi: 10.1016/j.cell.2018.09.037. Epub 2018 Oct 18.

Bifunctional Immunity Proteins Protect Bacteria against FtsZ-Targeting ADP-Ribosylating Toxins

Affiliations

Bifunctional Immunity Proteins Protect Bacteria against FtsZ-Targeting ADP-Ribosylating Toxins

See-Yeun Ting et al. Cell. .

Abstract

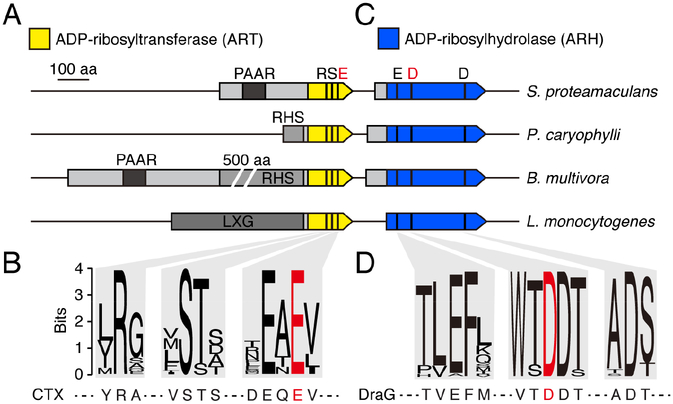
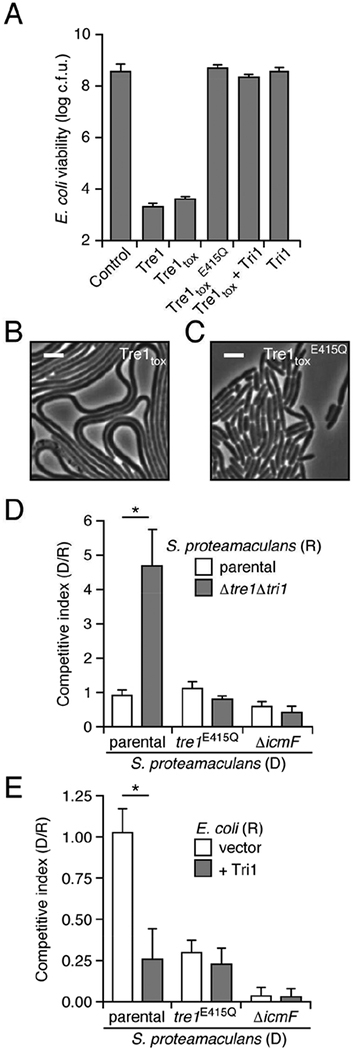
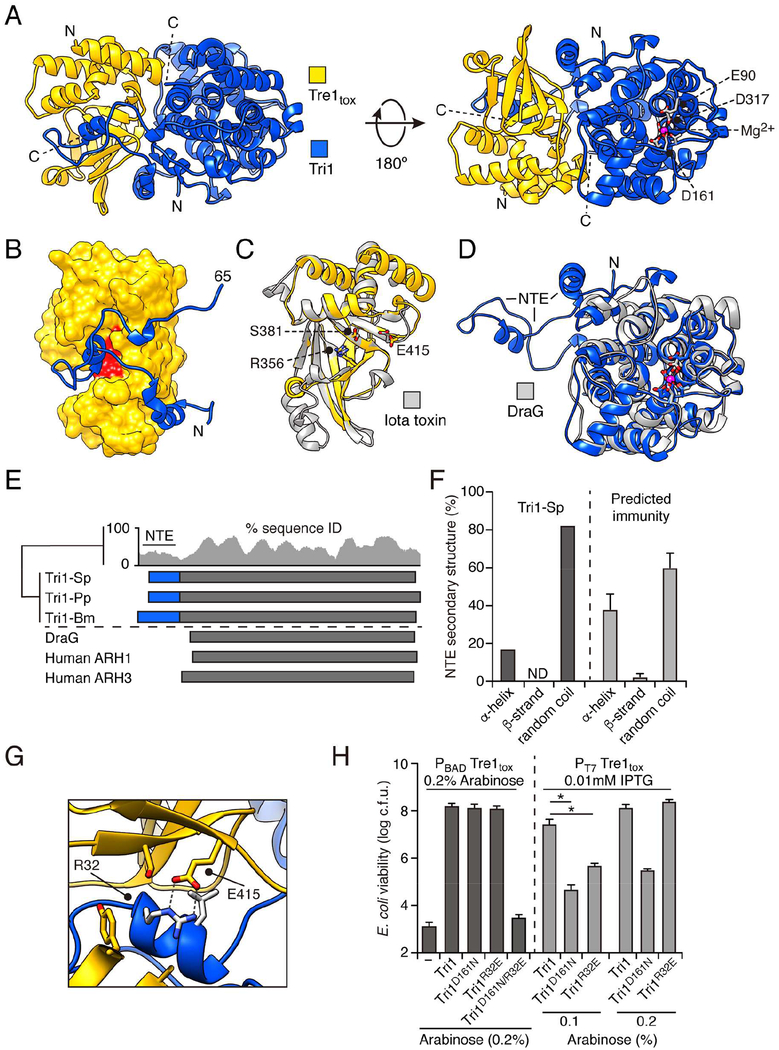
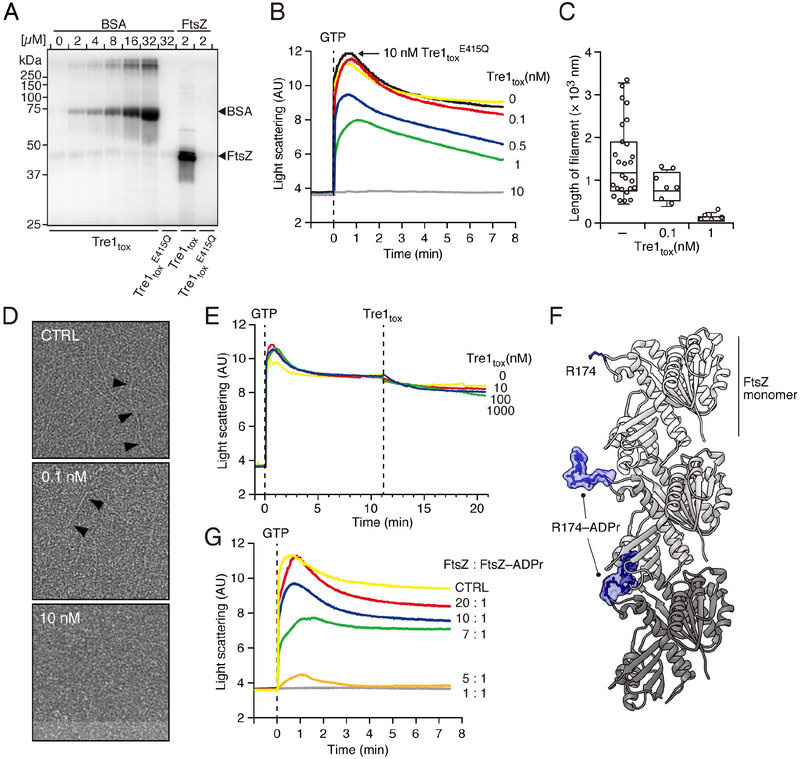
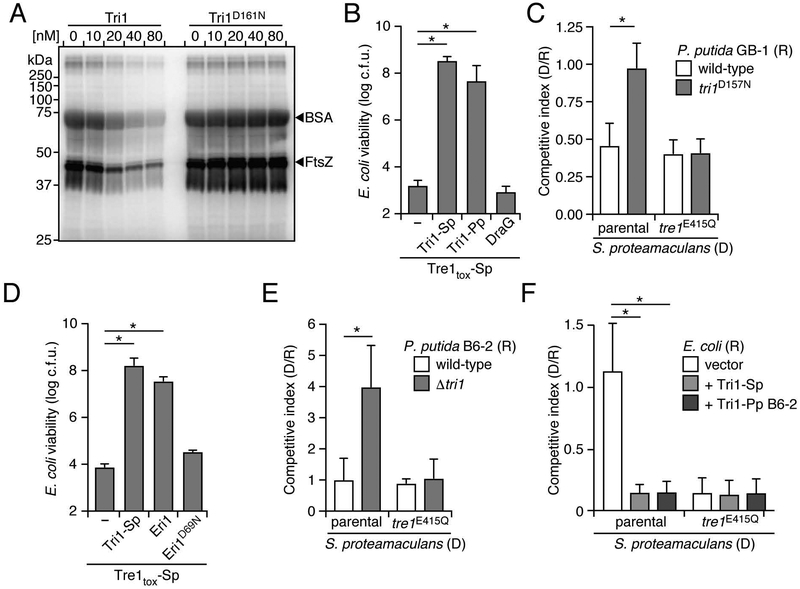
ADP-ribosylation of proteins can profoundly impact their function and serves as an effective mechanism by which bacterial toxins impair eukaryotic cell processes. Here, we report the discovery that bacteria also employ ADP-ribosylating toxins against each other during interspecies competition. We demonstrate that one such toxin from Serratia proteamaculans interrupts the division of competing cells by modifying the essential bacterial tubulin-like protein, FtsZ, adjacent to its protomer interface, blocking its capacity to polymerize. The structure of the toxin in complex with its immunity determinant revealed two distinct modes of inhibition: active site occlusion and enzymatic removal of ADP-ribose modifications. We show that each is sufficient to support toxin immunity; however, the latter additionally provides unprecedented broad protection against non-cognate ADP-ribosylating effectors. Our findings reveal how an interbacterial arms race has produced a unique solution for safeguarding the integrity of bacterial cell division machinery against inactivating post-translational modifications.

Keywords: ADP-ribosylation; Esx secretion; bacterial communities; toxin; type VI secretion.


Conflict of interest statement

Declaration of Interests

The authors declare no competing financial interests.

Figures

Figure 1.
Figure 1.
Proteins sharing conserved motifs with ART and ARH proteins are associated with interbacterial toxin delivery pathways. (A) and (C) Scaled depiction of representative genomic loci from the indicated species (Serratia proteamaculans, Pseudomonas caryophylli, Burkholderia mutltivora, Listeria monocytogenes) encoding predicted ART (yellow) and ARH (blue) domain-containing proteins. Regions encoding N-terminal domains of T6SS (PAAR, RHS) and Esx system (LXG) substrates shaded in grey. Black bars designate location of bases encoding the noted residues conserved in ART and ARH proteins; residues targeted for mutagenesis in this study depicted in red. (B) and (D) Sequence logos generated from alignments of ART (B) and ARH (D) family proteins associated with bacterial contact dependent antagonism pathways (locus tag numbers for genes encoding sequences used provided in Table S1). Sequences from characterized ART (CTX toxin) and ARH (DraG) shown below for reference. See also Table S1.
Figure 2.
Figure 2.
A predicted ART domain-containing substrate of the T6SS is an antibacterial toxin that promotes competitiveness of S. proteamaculans. (A) Viable E. coli cells recovered from plating cultures carrying plasmids expressing the indicated proteins on inducing media (c.f.u. = colony forming units). (B) and (C) Representative micrographs of E. coli cells expressing Tre1tox (B) or Tre1tox E415Q (C). Frames were acquired 200 min after induction of protein expression. Scale bar = 2 μm. (D) Relative competitiveness of the indicated donor (“D”) and recipient (“R”) strains of S. proteamaculans grown in co-culture on a solid surface for 6 h. Competitive index was determined by comparing final and initial c.f.u. ratios of the two strains. (E) Interspecies competition experiments between the indicated S. proteamaculans donor strains grown in co-culture with the noted E. coli recipients, quantified as in D. Data in A, D and E are represented as means ± standard deviation (SD). Asterisks in D and E indicate statistically significant differences between competitive indices of a given donor strain toward the indicated recipients (p<0.05). For experiments shown in A, D and E, n ≥ 3. See also Figure S1 and Videos S1 and S2.
Figure 3.
Figure 3.
Tri1 provides immunity to intoxication by Tre1 through two structurally distinct mechanisms. (A) Ribbon diagram representation of the X-ray crystal structure of Tre1tox (yellow) in complex with Tri1 (blue). Mg2+ ion and coordinating residues in the Tri1 active site shown in red. (B) Space filling depiction of Tre1 showing occlusion of active site residues R356, S381, and E415 (red) by the N-terminal extension (NTE) of Tri1 (blue). (C) and (D) Structural alignments of Tre1 (C) and Tri1 (D) with previously characterized ART and ARH proteins, respectively (grey). Region of Tri1 comprising the NTE is indicated. (E) Diagram of regions shared between Tri1 proteins and previously characterized ARH proteins (blue; NTE found only predicted ARH domain-containing immunity proteins). Gaps present in sequence alignments not shown. Conservation at each position (15 aa window) is shown above for all NTE-containing ARH domain proteins. (F) Proportion of the NTE segment consisting of the indicated secondary structure elements. For Tri1-Sp (dark grey), percentages determined from current structural analysis (PDB: 6DRE); for other Tri1 homologs (light grey), percentages represent average values from prediction analyses performed using GeneSilico Metaserver (n = 22 representative sequences). (G) Magnification of the active site of Tre1tox in complex with Tri1, showing electrostatic and hydrogen bond interactions between Arg32 of Tri1 and the catalytic glutamic acid (Glu415) of Tre1tox. (H) E. coli cells recovered following induction of heterologously expressed Tre1 and the indicated Tri1 alleles or empty vector control. Left panel (dark grey), expression of both proteins controlled by the pBAD promoter and induced by 0.2% arabinose; right panel (light grey), Tre1 expression controlled by the T7 promoter and induced by IPTG (0.01 mM) and Tri1 controlled by pBAD and induced by arabinose (indicated concentrations). Data are presented as means ± SD. Asterisks indicate significant differences in viability between populations expressing the indicated Tri1 variant proteins and the empty vector control, when induced with 0.1% arabinose (p<0.05, n ≥ 3). See also Figure S2 and Table S3.
Figure 4.
Figure 4.
Tre1 ADP-ribosylates FtsZ, disrupts Z ring formation and inhibits cell division. (A) Sequence of E. coli peptides ADP-ribosylated due to heterologous expression of Tre1tox-Sp. Red, modified residues; shading, peptides also modified by Tre1tox-Pp. (B) Tandem mass spectrum of the indicated peptide from E. coli FtsZ enriched by immunoprecipitation from cells in competition co-culture with Tre1-expressing S. proteamaculans. Fragmentation ions (b, blue; y, red) with resolved spectra and the site of ADP ribosylation (bold) are indicated. (C) Proportion of E. coli cells measuring greater than 2X the median cell length at the time of mixing (light grey), or after 6 hours co-culture on a solid medium (dark grey) with S. proteamaculans producing the indicated Tre1 proteins. Asterisk denotes statistically significant difference in E. coli cell size between the populations after competition (p<0.05, n > 1000, see also Figure S3L). (D and E) Time-lapse fluorescence and phase contrast microscopy sequences of E. coli cells expressing FtsZ-FP and carrying plasmids for the inducible expression of Tre1 (D) or Tre1tox E415Q (E). Cells were cultivated in a microfluidic chamber to enable the introduction of inducer. All cells in time-lapse series were defined by image segmentation with custom analysis software and Z ring dynamics of a representative cell (outlined in solid red, daughters outlined in dashed red) are provided (lower single cell image series) (Stylianidou et al., 2016). (F) Ratio of cell area (red) and average number of FtsZ-FP foci in E. coli cells expressing Tre1tox (black) or Tre1tox E415Q (blue) over the indicated time period. Tre1tox or Tre1tox E415Q induction, dashed line; 95% confidence intervals, grey shading. See also Video S3 and Figure S3.
Figure 5.
Figure 5.
Tre1 inhibits FtsZ polymerization in vitro. (A) Autoradiograph of SDS-PAGE-resolved products of purified BSA or FtsZ incubated with the noted Tre1tox variants and [adenylate-32P]-NAD+. (B) Polymerization of FtsZ pre-incubated with the indicated concentrations of Tre1tox and Tre1tox E415Q, as measured by 90° angle light scattering. GTP was added at T0 (dashed line) to initiate the polymerization reaction. (C, D) Negative stain electron microscopy analysis of FtsZ polymers formed following 5 min incubation with the indicated concentrations of Tre1tox and a reduced concentration of crowding reagent compared to that employed for experiments depicted in B. Average filament lengths, (C), representative electron micrographs, (D). Black arrows highlight individual polymers. (E) Impact of Tre1tox addition (dashed line) on pre-formed FtsZ polymers, measured as in B. (F) Modeled structure of an E. coli FtsZ filament containing 3 monomers (shades of grey) with position ADP-ribosylated by Tre1 highlighted (R174, blue). Top, R174 in stick representation; middle, R174-ADPr in molecular surface representation; bottom, R174-ADPr in alternative rotomer that induces steric clashes between protomers. The FtsZ monomer structure was generated with MODELLER based on FtsZ from Staphylococcus aureus (PDB 5MN4) (Wagstaff et al., 2017) and the polymer was generated based on crystallographic symmetry. (G) Effect of adding FtsZ–ADPr at the indicated ratios to polymerization reactions of unmodified FtsZ. FtsZ-ADPr subunits were generated by incubating with an equimolar concentration of NAD+ to avoid excess ADP-ribosylation. Total FtsZ concentration (FtsZ + FtsZ-ADPr) was kept at 12.5 μM in all assays, and polymerization was quantified as in B.
Figure 6.
Figure 6.
ARH domain-containing immunity proteins provide protection from non-cognate ART toxins. (A) Autoradiograph of SDS-resolved products resulting from incubating a mixture of FtsZ and BSA (1:16 ratio) with Tre1tox and [adenylate-32P]-NAD+ to facilitate ADPr, followed by treatment with the indicated Tri1 proteins. (B and D) Viable E. coli recovered from populations expressing Tre1tox-Sp and the indicated ARH-domain proteins. (C) Competitiveness of the indicated donor (D) strains of S. proteamaculans toward wild-type or a tri1 mutant of P. putida GB-1, after 6 h coculture on a solid medium. (E) Competitiveness of indicated donor strains of S. proteamaculans toward the noted recipient strains of P. putida B6–2 as grown in C. (F) Competitiveness of S. proteamaculans toward E. coli heterologously expressing a vector control, Tri1 from S. proteamaculans or Tri1 from P. putida B6–2, grown as in C. Data in B-F represent means ± SD. Asterisks in B-F indicate statistically significant differences between the indicated mean values (p<0.05, n = 3). See also Figure S4.

Comment in

References

    1. Abebe-Akele F, Tisa LS, Cooper VS, Hatcher PJ, Abebe E, and Thomas WK (2015). Genome sequence and comparative analysis of a putative entomopathogenic Serratia isolated from Caenorhabditis briggsae. BMC genomics 16, 531. - PMC - PubMed
    1. Aktories K, and Wegner A (1992). Mechanisms of the cytopathic action of actin-ADP-ribosylating toxins. Mol Microbiol 6, 2905–2908. - PubMed
    1. Alcoforado Diniz J, Liu YC, and Coulthurst SJ (2015). Molecular weaponry: diverse effectors delivered by the Type VI secretion system. Cellular microbiology 17, 1742–1751. - PMC - PubMed
    1. Aravind L, Zhang D, de Souza RF, Anand S, and Iyer LM (2015). The natural history of ADP-ribosyltransferases and the ADP-ribosylation system. Current topics in microbiology and immunology 384, 3–32. - PMC - PubMed
    1. Berthold CL, Wang H, Nordlund S, and Hogbom M (2009). Mechanism of ADP-ribosylation removal revealed by the structure and ligand complexes of the dimanganese mono-ADP-ribosylhydrolase DraG. Proc Natl Acad Sci U S A 106, 14247–14252. - PMC - PubMed

Publication types

MeSH terms