. 2018 Nov 1;175(4):1141-1155.e16.
doi: 10.1016/j.cell.2018.09.022. Epub 2018 Oct 18.

Protein Barcodes Enable High-Dimensional Single-Cell CRISPR Screens

Affiliations

Protein Barcodes Enable High-Dimensional Single-Cell CRISPR Screens

Aleksandra Wroblewska et al. Cell. .

Abstract

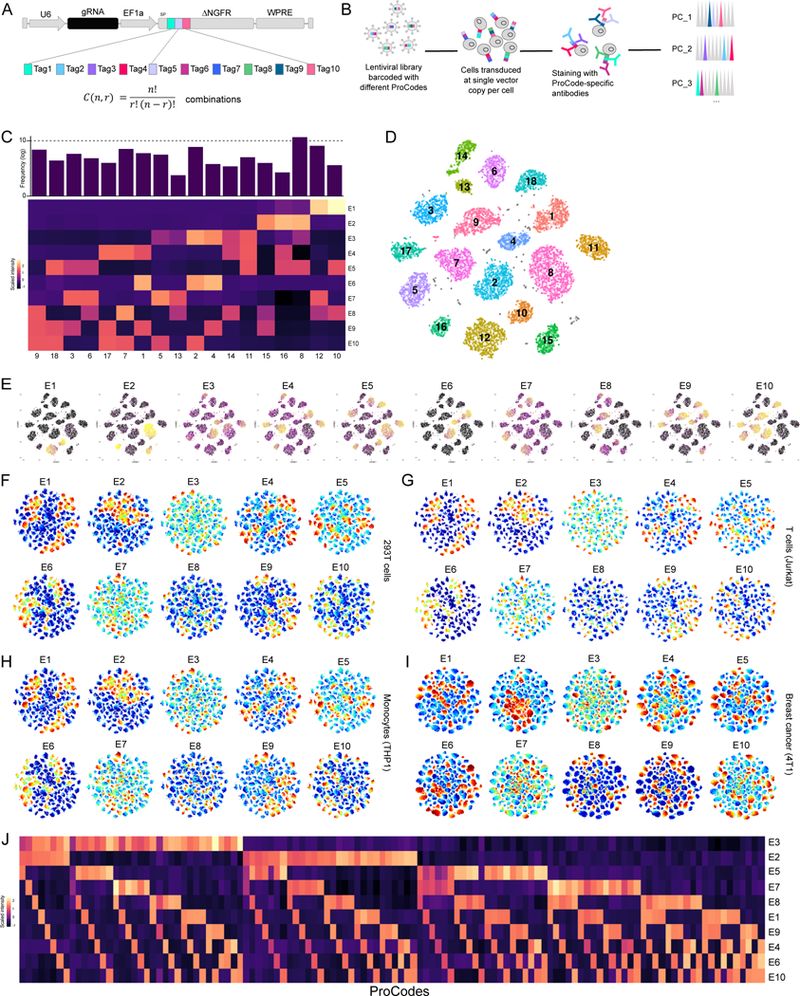
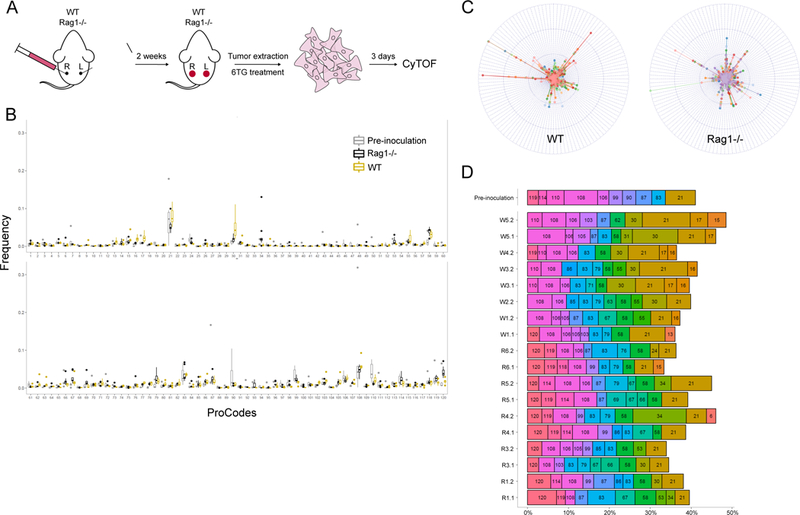
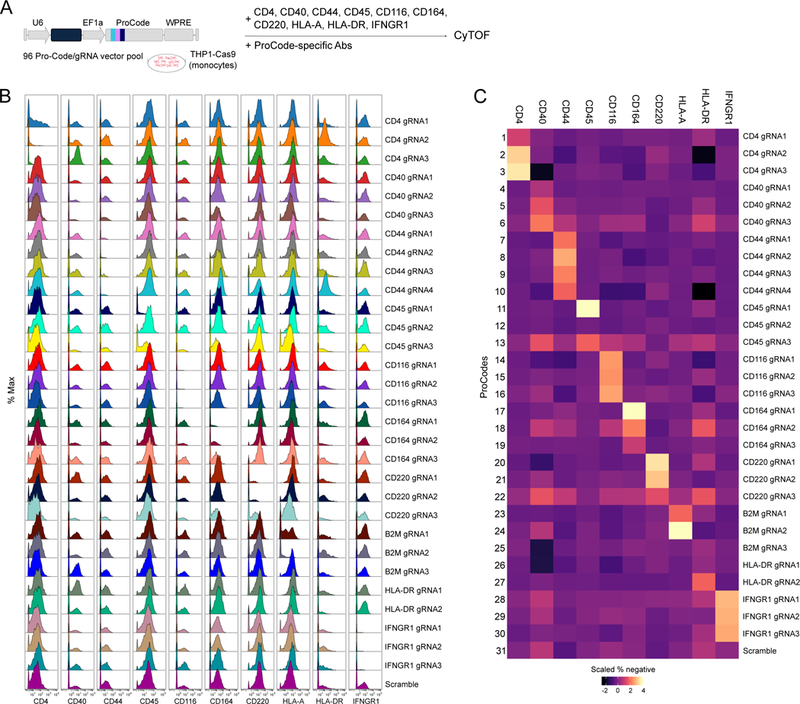
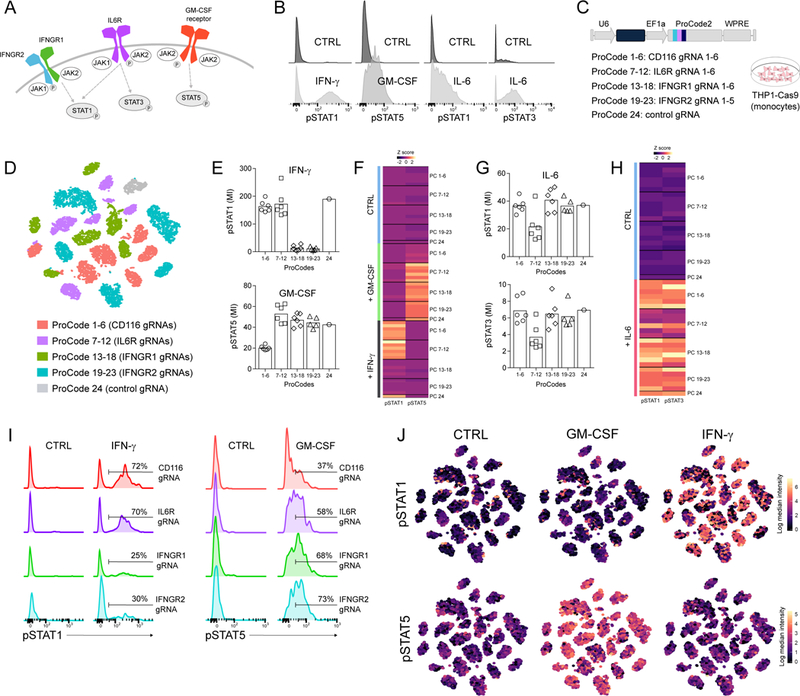
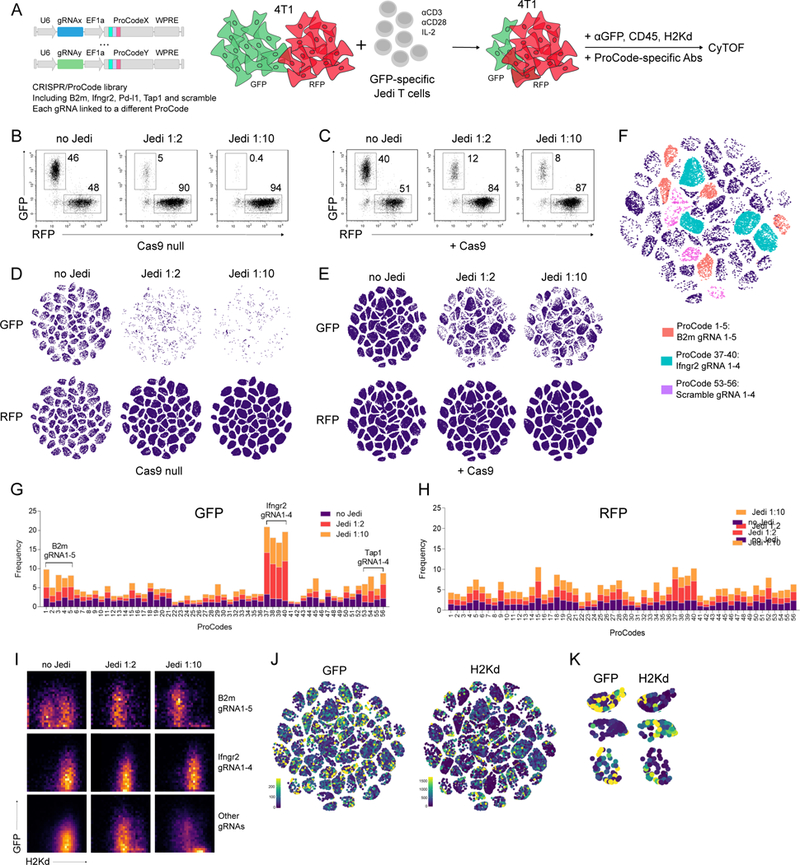
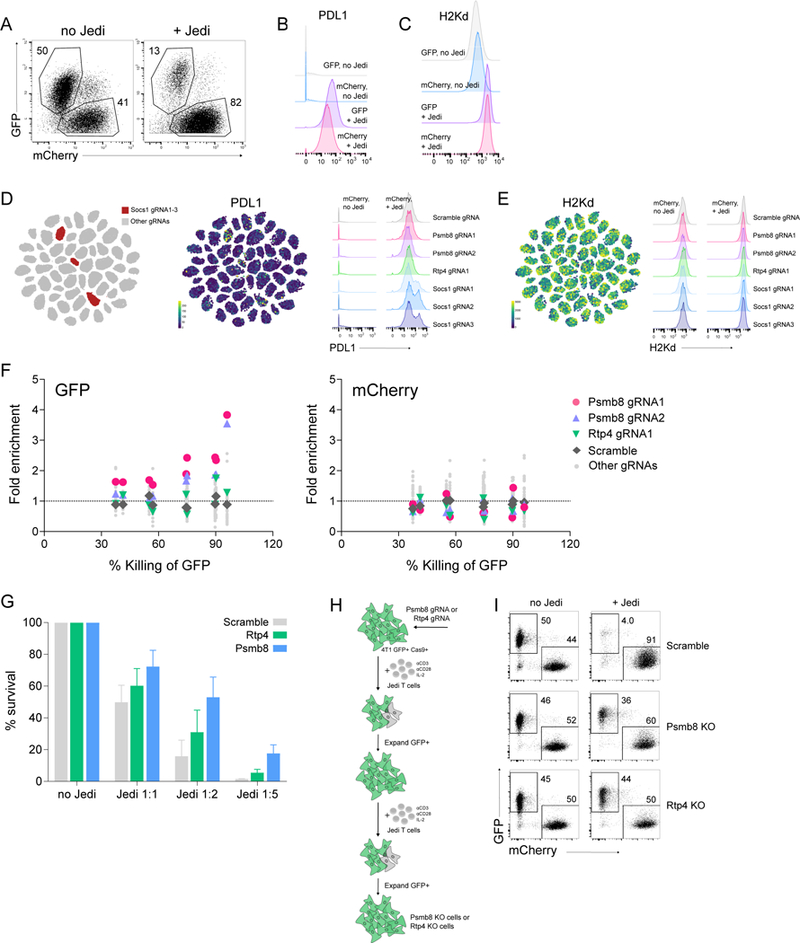
CRISPR pools are being widely employed to identify gene functions. However, current technology, which utilizes DNA as barcodes, permits limited phenotyping and bulk-cell resolution. To enable novel screening capabilities, we developed a barcoding system operating at the protein level. We synthesized modules encoding triplet combinations of linear epitopes to generate >100 unique protein barcodes (Pro-Codes). Pro-Code-expressing vectors were introduced into cells and analyzed by CyTOF mass cytometry. Using just 14 antibodies, we detected 364 Pro-Code populations; establishing the largest set of protein-based reporters. By pairing each Pro-Code with a different CRISPR, we simultaneously analyzed multiple phenotypic markers, including phospho-signaling, on dozens of knockouts. Pro-Code/CRISPR screens found two interferon-stimulated genes, the immunoproteasome component Psmb8 and a chaperone Rtp4, are important for antigen-dependent immune editing of cancer cells and identified Socs1 as a negative regulator of Pd-l1. The Pro-Code technology enables simultaneous high-dimensional protein-level phenotyping of 100s of genes with single-cell resolution.

Keywords: CRISPR; T cells; cancer; functional genomics; interferon gamma pathway; mass cytometry; pooled screen; protein barcodes; single cell analysis; tumor immunology.


Figures

Figure 1.
Figure 1.. Single cell analysis of 120 Pro-Code expressing populations.
(A) Schematic of the Pro-Code vectors. (n) linear epitopes, (r) positions, (C) Pro-Codes. (B) Schematic of transduction, staining, and analysis. (C) 293T cells were transduced with 18 different Pro-Code vectors, stained for each epitope, and analyzed by CyTOF. Heatmap of relative expression of each epitope (E1-E10). (D) viSNE clustering of data in (C). (E) viSNE plots showing expression of each epitope from (C). Expression is scaled from high to low (yellow to dark purple). (F) 293T, (G) Jurkat, (H) THP1 and (I) 4T1 were transduced with a pool of 120 Pro-Codes vectors, and analyzed by CyTOF. Shown is the viSNE clustering with expression of each epitope (E1–10) colored from high to low (red to blue). (J) Heatmap showing epitope (E) expression for each of the 120 Pro-Code populations in 293T. All data is representative of 3 independent experiments.
Figure 2.
Figure 2.. Analysis of Pro-Code labeled breast tumors.
(A) Schematic of the in vivo 4T1 tumor studies. (B) Frequency of each Pro-Code population in tumors from wild-type and Rag1−/− mice. Shown is the median ± interquartile range (8–10 tumors/mouse group). Also included is the frequency of each Pro-Code in the 4T1 cells prior to inoculation (Pre-inoculation). (C) Distribution of the Pro-Code populations among each tumor. Data is presented in radar plots. The distance from the center represents the frequency of a Pro-Code population (each color represents a tumor, each quadrant corresponds to cells expressing a different Pro-Code). (D) Frequency of the 10 most abundant Pro-Code populations in each individual tumor. On the Y axis are individual tumors from WT (W) or Rag1-/” (R) mice. Numbers in the bars correspond to Pro-Code identifications.
Figure 3.
Figure 3.. High content phenotypic analysis of monocytic cells engineered with a Pro-Code/CRISPR library.
(A) Schematic of the Pro-Code/CRISPR phenotypic analysis. (B) Expression of the indicated proteins on each Pro-Code/CRISPR cell population. Shown are representative histograms for each Pro-Code population. The Y axis represents cell count normalized by protein detection channel. (C) Heatmap representation of the relative percent of protein negative cells for each Pro-Code population. All data is representative of 2 independent experiments.
Figure 4.
Figure 4.. Analysis of phospho-STAT signaling in Pro-Code/CRISPR engineered cells.
(A) Schematic overview of phospho-signaling downstream of the IFNγ, GM-CSF (CD116) and IL-6 (CD126) receptors. (B) THP1-Cas9 were stimulated with IFNγ, GM-CSF, IL-6 or PBS (ctrl), stained for pSTAT1, pSTAT3 and pSTAT5, and analyzed by CyTOF. Representative histograms shown (n=3 independent experiments). (C) Schematic of the ProCode/CRISPR library used in (D-J). (D) THP1-Cas9 were transduced with the 24 Pro-Code/CRISPR library, stimulated with the indicated cytokine, and analyzed for the Pro-Codes and pSTAT1 and pSTAT3 by CyTOF. Shown is the viSNE visualization of 24 Pro-Code/CRISPR populations colored by the target gene. (E) Expression of pSTAT1 and pSTAT5 in each Pro-Code population after GM-CSF or IFNγ. Bar plots present mean intensity (MI). Each point is a different Pro-Code/gRNA. (F) Relative expression of pSTAT1 and pSTAT5 across all CRISPR/Pro-Code populations after GM-CSF or IFNγ. (G) Expression of pSTAT1 and pSTAT3 in each Pro-Code population after IL-6. Bar plots present MI. (H) Relative expression of pSTAT1 and pSTAT3 across all CRISPR/Pro-Code populations after IL-6. (I) Levels of pSTAT1 and pSTAT5 after IFNγ and GM-CSF, respectively, in different ProCode/CRISPR populations; representative histograms shown. Y axis represents relative cell count. (J) viSNE visualization of pSTAT1 and pSTAT5 levels after GM-CSF or IFNγ. The Pro-Code/CRISPR identity of each cluster can be found in (D). Data is representative of 3 independent experiments.
Figure 5.
Figure 5.. Pro-Code/CRISPR screen for genes conferring sensitivity or resistance to antigen-dependent T cell killing.
(A) Schematic of the immune editing co-culture system and the ProCode/CRISPR library. 4T1 cells (+/−Cas9, +/−GFP/RFP) were transduced with a library of 56 ProCode/CRISPR vectors, co-cultured with activated Jedi T cells, and analyzed by CyTOF. (B) Frequency of GFP+ and RFP+ 4T1 cells was measured by flow cytometry. Representative dotplots are shown. Jedi 1:2 and Jedi 1:10 is 2-fold and 10-fold multiple of T cells to cancer cells, respectively. (C) Frequency of GFP+ and RFP+ 4T1-Cas9 cells was measured by flow cytometry. Representative dotplots are shown. (D) viSNE visualization of the 4T1-GFP and 4T1-RFP Pro-Code populations co-cultured alone or with activated Jedi T cells. Each cluster corresponds to a different Pro-Code. (E) viSNE visualization of the 4T1-GFP-Cas9 and 4T1-RFP-Cas9 Pro-Code populations co-cultured alone or with activated Jedi T cells. Each cluster corresponds to a different Pro-Code. (F) viSNE visualization of 56 Pro-Code/CRISPR populations (GFP-4T1-Cas9, Jedi 1:10) colored by the target: orange=B2m, cyan=Ifngr2, purple=scramble, navy=others. (G, H) Frequency of each Pro-Code/CRISPR populations among the GFP-4T1-Cas9 (G) and RFP-4T1-Cas9 (H) cells in the absence (no Jedi) or presence (Jedi 1:2, Jedi 1:10) of GFP- specific Jedi T cells. (I) GFP and H2Kd expression on 4T1-Cas9-GFP cells expressing gRNAs targeting B2m, Ifngr2 and all other genes. (J) GFP and H2Kd expression levels Pro-Code/CRISPR populations in GFP-4T1-Cas9 cells resisting T cell killing (Jedi 1:10); (K) GFP and H2Kd expression on selected Pro-Code populations (from J). Data is representative of 3 independent experiments.
Figure 6.
Figure 6.. Pro-Code/CRISPR analysis of select IFN𝛄-inducible genes in cancer cell killing by antigen-specific T cells.
(A-F) 4T1-Cas9-GFP and 4T1-Cas9-mCherry cells were transduced with 56 ProCode/CRISPR vectors, mixed in a 1:1 ratio, and co-cultured with activated Jedi T cells. On day 3, cells were collected, stained for the Pro-Code, as well as GFP, mCherry, CD45, H2Kd and PD-L1, and analyzed by CyTOF. (A) Frequency of cells were measured by CyTOF; no Jedi - no T cells added, + Jedi - 4-fold excess of T cells over cancer cells. Representative dotplots shown. (B) PDL1 (C) H2Kd expression in the bulk GFP+ and mCherry+ cell populations. (D, E) viSNE visualization and histograms showing PDL1 (D) and H2Kd (E) expression on individual Pro-Code/CRISPR populations among mCherry+ cells. (F) Fold enrichment of Psmb8, Rtp4 and scramble Pro-Code/CRISPR populations (+ Jedi vs. no Jedi conditions) shown as a function of % killing by Jedi T cells. Each point is from an independent experiment with two different ratios of Jedi to cancer cells. 4 independent experiments were performed. (G) GFP-4T1-Cas9 cells were transduced with gRNAs targeting Psmb8, Rtp4 or scramble gRNA. The frequency of GFP+ cells in the absence (no Jedi) or presence (Jedi 1:1, Jedi 1:2, Jedi 1:5) of Jedi T cells was determined by flow cytometry. Bar graphs present the mean±SD (n = 3). 4T1-Cas9-mCherry cells were used as control. Note that the percent of surviving cells is dependent on CRISPR knockout efficiency, and is thus not quantitative, as indicated by (I). (H) Schematic overview of the Psmb8 and Rtp4 validation approach. (I) 4T1-Cas9-GFP cells transduced with a vector encoding a Psmb8, Rtp4, or scramble gRNA were selected as shown in (H) and mixed with activated Jedi T cells, and cultured for 3 days. Frequency of GFP+ and mCherry+ cells in the absence (no Jedi) or presence (+ Jedi) of Jedi T cells is shown. Dotplots are representative of 2 independent experiments.

Comment in

  • Protein-based cell barcodes.
    Nawy T. Nawy T. Nat Methods. 2018 Dec;15(12):1002. doi: 10.1038/s41592-018-0250-5. Nat Methods. 2018. PMID: 30504877 No abstract available.

References

    1. Adamson B, Norman TM, Jost M, Cho MY, Nunez JK, Chen Y, Villalta JE, Gilbert LA, Horlbeck MA, Hein MY, et al. (2016). A Multiplexed Single-Cell CRISPR Screening Platform Enables Systematic Dissection of the Unfolded Protein Response. Cell 167, 1867–1882.e21. - PMC - PubMed
    1. Adamson B, Norman TM, Jost M, and Weissman JS (2018). Approaches to maximize sgRNA-barcode coupling in Perturb-seq screens. BioRxiv 298349.
    1. Agudo J, Ruzo A, Park ES, Sweeney R, Kana V, Wu M, Zhao Y, Egli D, Merad M, and Brown BD (2015). GFP-specific CD8 T cells enable targeted cell depletion and visualization of T-cell interactions. Nat. Biotechnol. 33, 1287–1292. - PMC - PubMed
    1. Agudo J, Park ES, Rose SA, Alibo E, Sweeney R, Dhainaut M, Kobayashi KS, Sachidanandam R, Baccarini A, Merad M, et al. (2018). Quiescent Tissue Stem Cells Evade Immune Surveillance. Immunity 48, 271–285.e5. - PMC - PubMed
    1. Amir ED, Davis KL, Tadmor MD, Simonds EF, Levine JH, Bendall SC, Shenfeld DK, Krishnaswamy S, Nolan GP, and Pe’er D (2013). viSNE enables visualization of high dimensional single-cell data and reveals phenotypic heterogeneity of leukemia. Nat. Biotechnol. 31, 545–552. - PMC - PubMed

Publication types