. 2018 Nov 13;11(5):1171-1184.
doi: 10.1016/j.stemcr.2018.09.006. Epub 2018 Oct 18.

T-type Calcium Channels Determine the Vulnerability of Dopaminergic Neurons to Mitochondrial Stress in Familial Parkinson Disease

Affiliations

T-type Calcium Channels Determine the Vulnerability of Dopaminergic Neurons to Mitochondrial Stress in Familial Parkinson Disease

Yoshikuni Tabata et al. Stem Cell Reports. .

Abstract

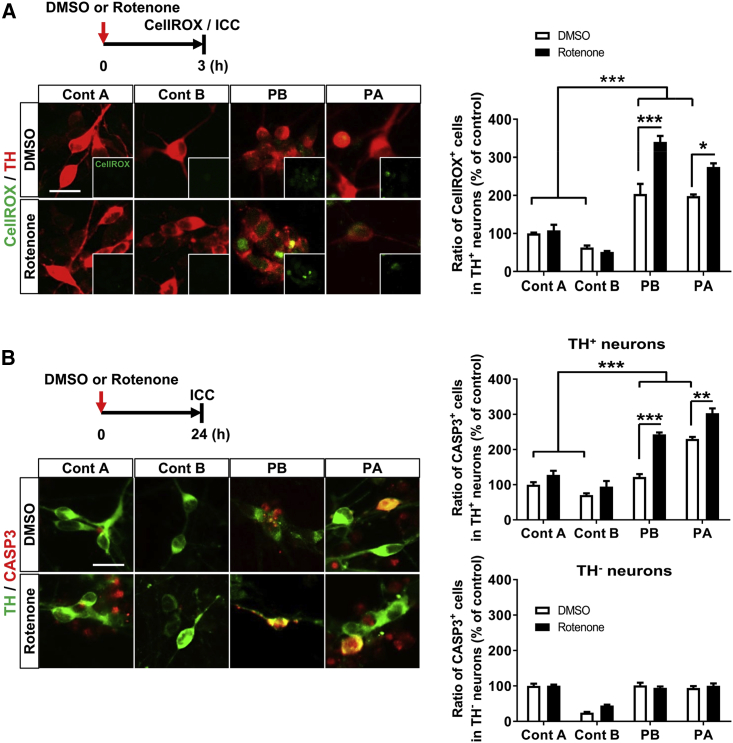
Parkinson disease (PD) is a progressive neurological disease caused by selective degeneration of dopaminergic (DA) neurons in the substantia nigra. Although most cases of PD are sporadic cases, familial PD provides a versatile research model for basic mechanistic insights into the pathogenesis of PD. In this study, we generated DA neurons from PARK2 patient-specific, isogenic PARK2 null and PARK6 patient-specific induced pluripotent stem cells and found that these neurons exhibited more apoptosis and greater susceptibility to rotenone-induced mitochondrial stress. From phenotypic screening with an FDA-approved drug library, one voltage-gated calcium channel antagonist, benidipine, was found to suppress rotenone-induced apoptosis. Furthermore, we demonstrated the dysregulation of calcium homeostasis and increased susceptibility to rotenone-induced stress in PD, which is prevented by T-type calcium channel knockdown or antagonists. These findings suggest that calcium homeostasis in DA neurons might be a useful target for developing new drugs for PD patients.

Keywords: PARK2; Parkinson disease; T-type calcium channels; disease modeling; induced pluripotent stem cells.


Figures

None
Graphical abstract
Figure 1
Figure 1
Characterization of Dopaminergic Neurons Derived from PARK2 Patient-Specific and Isogenic PARK2−/− iPSC Lines (A) Experimental paradigm for differentiation of human iPSC-derived NPCs toward DA neurons. Scale bars, 100 μm. (B) Properties of iPSC-derived NPCs from the Control A (AF22), Control B (201B7), PARK2−/− (B7PA21), PA (PA9), and PB (PB2) lines. Immunocytochemical staining was performed with antibodies against neural stem cell-associated markers (SOX1, SOX2, DACH1, and nestin). Scale bar, 100 μm. (C) Quantitative analyses of cells positive for βIII-tubulin, MAP2, TH, and GFAP. Data represent the means ± SEM (n = 4–6 independent biological replicates). (D) Characterization of DA neurons from Control A, Control B, PARK2−/−, PA, and PB at differentiation day 14. Immunocytochemical staining was performed with antibodies against neuronal markers (βIII-tubulin and MAP2), an astrocytic marker (GFAP), a dopaminergic neuron marker (TH), midbrain markers (FOXA2, EN1, NURR1, and GIRK2) and dopamine. Insets are the images of GFAP+ signals. Scale bar, 100 μm. (E) Quantification of dopamine released from control iPSC (Control B)-derived DA neurons. Data represent the means ± SEM (n = 4 independent biological replicates). (F) A comparison of the levels of dopamine released by DA neurons from Control A and PB on day 14. Data represent the means ± SEM (n = 5 independent biological replicates). (G) Neurite length was examined in the DA neurons derived from Control A and PARK2 patient-specific NPCs (PB and PA) on day 14. Quantification of the neurite length is shown (right). Data represent the means ± SEM (n = 4–10 independent biological replicates). ∗∗∗p < 0.001 by an unpaired t test. Scale bar, 100 μm. (H) Neurite length was examined in DA neurons derived from a PARK2−/− line and the parental line (Control B) on day 14. Quantification is shown (right). Data represent the means ± SEM (n = 4 independent biological replicates). ∗∗∗p < 0.001 by an unpaired t test. Scale bar, 100 μm. (I) Elevated intracellular oxidative stress in PARK2- and PARK2−/−-DA neurons. Intracellular oxidative stress was assessed in DA neurons on day 14 with an indicator, CellROX. Representative images of CellROX+ signals in the DA neurons are shown (left). Insets are the images of CellROX+ signals. Scale bar, 20 μm. Quantification is shown (right). Data represent the means ± SEM (n = 3 independent biological replicates). p < 0.05, ∗∗p < 0.01, ∗∗∗p < 0.001 by Dunnett's multiple comparison test. (J) The abundance of apoptotic cells was increased in PARK2- and PARK2−/−-DA neurons on day 14. Representative images of cleaved caspase-3 (CASP3) immunostaining are shown (left). Scale bar, 20 μm. Quantification is shown (right). Data represent the means ± SEM (n = 7–10 independent biological replicates). ∗∗p < 0.01, ∗∗∗p < 0.001 by Dunnett's multiple comparison test.
Figure 2
Figure 2
PARK2-Dopaminergic Neurons Showed Increased Susceptibility to Rotenone-Induced Stress (A) Enhancement of the CellROX+ fraction by rotenone treatment in PARK2-DA neurons on day 14. Representative staining images of CellROX+ cells with or without rotenone exposure (10 μM, 3 hr) are shown (left). Insets are the images of CellROX+ signals. Quantification is shown (right). Data represent the means ± SEM (n = 3–10 independent biological replicates). p < 0.05, ∗∗∗p < 0.001 by Tukey's multiple comparison test. Scale bar, 20 μm. (B) Immunocytochemical analysis of CASP3+ cells in DA neurons on day 14 with or without rotenone treatment (10 μM, 24 hr). Cells marked as TH neurons represent the population of TH and βIII-tubulin+ neurons. Quantification of apoptotic cells in TH+ neurons and TH neurons. Data represent the means ± SEM (n = 3–6 independent biological replicates). ∗∗p < 0.01, ∗∗∗p < 0.001 by Tukey's multiple comparison test. Scale bar, 20 μm.
Figure 3
Figure 3
A Calcium Channel Antagonist Protected against Rotenone-Induced Apoptosis and Rescued Impaired Neurite Outgrowth in PARK2-Dopaminergic Neurons (A) Experimental paradigm to identify chemical compounds targeting PD. PARK2-DA neurons (PB) were exposed to rotenone (10 μM) or DMSO for 24 hr. In the compound screening, the DA neurons were treated with test compounds (10 μM) in duplicate for 24 hr prior to rotenone treatment. (B) Representative data from initial screening. The vertical axis shows the inhibitory effect of the test compounds on rotenone-induced apoptosis. Each dot represents an individual compound. The red line indicates 50% of the control value. Eighty-eight of 1,165 compounds were found to reduce CASP3 levels to <50% (% of rotenone-exposed PARK2-DA neuron count). (C and D) Protective effects of (C) benidipine and (D) ML218 on rotenone-mediated (10 μM, 24 hr) apoptosis. Representative images of CASP3+ cells in DA neurons are shown (left). Insets are the images of CASP3+ signals. Data represent the means ± SEM (n = 3–16 independent biological replicates). p < 0.05, ∗∗p < 0.01, ∗∗∗p < 0.001 by Dunnett's multiple comparison test. Scale bar, 100 μm. (E) Neurite length was examined in the control and PARK2-derived neurons treated with DMSO or benidipine (10 μM) for 6 days. Quantification of the neurite length is shown (right). Data represent the means ± SEM (n = 4 independent biological replicates). p < 0.05, ∗∗p < 0.01 by a t test with Sidak's correction.
Figure 4
Figure 4
A Calcium Channel Antagonist Displayed Neuroprotective Effects in Dopaminergic Neurons Derived from a PARK6 Patient-Specific iPSC Line (A) Representative images of iPSCs, NPCs, and DA neurons derived from a PARK6 patient with PINK1 mutations (PKB3). The expression of four neural stem cell-related markers, including SOX1, SOX2, DACH1, and nestin, indicated that the cells are neural stem cells. PARK6-DA neurons on day 14 expressed DA neuron markers, such as βIII-tubulin, MAP2, TH, FOXA2, EN1, and GIRK2. Scale bar, 100 μm. (B) Reduced neurite length in PARK6-DA neurons on day 14 compared with the control (Control A). Quantification of neurite length is shown. Data represent the means ± SEM (n = 4 independent biological replicates). ∗∗p < 0.01 by an unpaired t test. (C) Immunocytochemical analysis of CellROX+ cells in DA neurons (Control A and PARK6) on day 14 with or without rotenone treatment (10 μM, 3 hr). Data represent the means ± SEM (n = 3 independent biological replicates). ∗∗p < 0.01 by Tukey's multiple comparison test. (D) Immunocytochemical analysis of CASP3+ cells in DA neurons (Control A and PARK6) on day 14 with or without rotenone treatment (10 μM, 24 hr). Data represent the means ± SEM (n = 3 independent biological replicates). ∗∗∗p < 0.001 by Tukey's multiple comparison test. (E) The PARK6-DA neurons were treated with benidipine 24 hr prior to rotenone treatment (10 μM, 24 hr). Data represent the means ± SEM (n = 6–12 independent biological replicates). p value was calculated by Dunnett's multiple comparison test. (F) Neurite length was examined in the control (Control A) and PARK6-DA neurons treated with DMSO or benidipine (10 μM) for 6 days. Data represent the means ± SEM (n = 4 independent biological replicates). p < 0.05 by a t test with Sidak's correction.
Figure 5
Figure 5
Dysregulation of Calcium Homeostasis in PARK2-Dopaminergic Neurons was Suppressed by Selective T-type Calcium Channel Inhibition (A) Immunocytochemistry was performed on day 14 for the T-type calcium channel subtypes (CaV3.1, CaV3.2, and CaV3.3). Representative image of calcium channel subtypes in DA neurons (left). The relative expression levels of calcium channel subtypes are shown (right). Data represent the means ± SEM (n = 4 independent biological replicates). p < 0.05, ∗∗p < 0.01, ∗∗∗p < 0.001 by a t test with Sidak's correction. Scale bar, 20 μm. (B) Measurement of intracellular calcium levels of neurons (Control A, PB, and PA) on day 14 with or without rotenone treatment (10 μM, 24 hr) by the fluorescent calcium indicator Fluo-8 AM. Data represent the means ± SEM (n = 3–4 independent biological replicates). ∗∗∗p < 0.001 by Tukey's multiple comparison test. (C) The effect of CCAs on the intracellular calcium concentration in PARK2-DA neurons (PB). The cells were exposed to benidipine (1 μM) or ML218 (1 μM) 24 hr prior to rotenone treatment. Data represent the means ± SEM (n = 3–6 independent biological replicates). p < 0.05, ∗∗p < 0.01 by Dunnett's multiple comparison test. (D) Knockdown was performed on day 14 with transient siRNA transfection, Accell siRNA (1 μM) against T-type calcium channel subtypes for 72 hr in the control DA neurons (Control B), and verified with qRT-PCR. Values were normalized to the expression of GAPDH, and changes in mRNA levels were measured relative to non-targeting control siRNA levels. Data represent the means ± SEM (n = 3 independent biological replicates). p < 0.05, ∗∗p < 0.01 by an unpaired t test. (E and F) Requirement of T-type calcium channel subtypes for the vulnerability of (E) PARK2 (PB)- and (F) PARK2−/−-DA neurons. The cells were transfected with siRNA against the various T-type calcium channel subtypes for 72 hr prior to rotenone treatment. Immunocytochemical analysis of the CASP3+ cells in DA neurons on day 14 with rotenone treatment (10 μM, 24 hr). Representative image of CASP3+ cells in PARK2-DA neurons are shown (left). Data represent the means ± SEM (n = 3 independent biological replicates). p < 0.05, ∗∗p < 0.01 by Dunnett's multiple comparison test. Scale bar, 20 μm.
Figure 6
Figure 6
Calcium Homeostasis Dysregulation Triggers Selective Vulnerability of Dopaminergic Neurons to Rotenone-Induced Stress in PARK2 Schematics of calcium homeostasis dysregulation in PARK2-DA neurons. When normal DA neurons were exposed to rotenone, damaged mitochondria were removed by Parkin- and PINK1-mediated mitophagy, allowing normal function to be maintained. However, mitochondrial function could not be restored due to the abnormality of the mitochondrial quality control mechanism in rotenone-exposed PARK2-DA neurons. Therefore, intracellular calcium overload promoted mitochondrial dysfunction and caused cell death specifically in DA neurons. Selective inhibition of T-type calcium channels suppressed the increase in intracellular calcium levels and cell death.

References

    1. Athauda D., Foltynie T. The ongoing pursuit of neuroprotective therapies in Parkinson disease. Nat. Rev. Neurol. 2015;11:25–40. - PubMed
    1. Bezprozvanny I.B. Calcium signaling and neurodegeneration. Acta Naturae. 2010;2:72–82. - PMC - PubMed
    1. Blesa J., Przedborski S. Parkinson's disease: animal models and dopaminergic cell vulnerability. Front. Neuroanat. 2014;8:155. - PMC - PubMed
    1. Cali T., Ottolini D., Brini M. Mitochondrial Ca(2+) and neurodegeneration. Cell Calcium. 2012;52:73–85. - PMC - PubMed
    1. Cheng H.C., Ulane C.M., Burke R.E. Clinical progression in Parkinson disease and the neurobiology of axons. Ann. Neurol. 2010;67:715–725. - PMC - PubMed

Publication types

MeSH terms