Review
. 2018 Oct 12:3:29.
doi: 10.1038/s41525-018-0068-1. eCollection 2018.

Complex genetics of female fertility

Affiliations
Review

Complex genetics of female fertility

Rahul Gajbhiye et al. NPJ Genom Med. .

Abstract

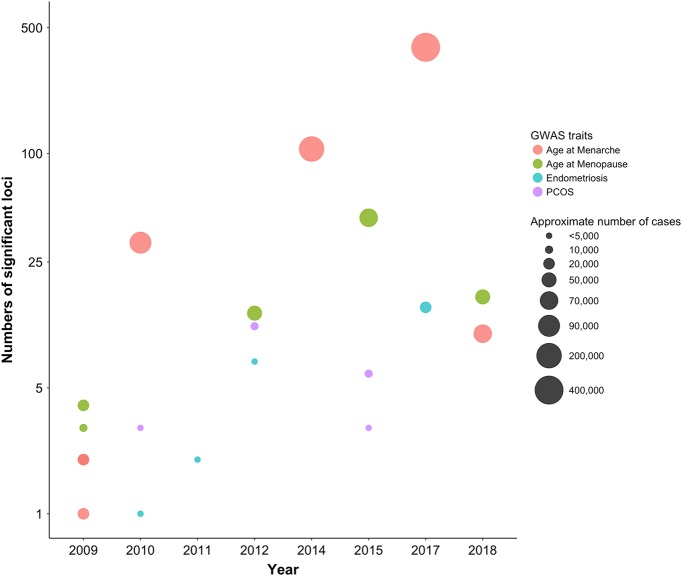
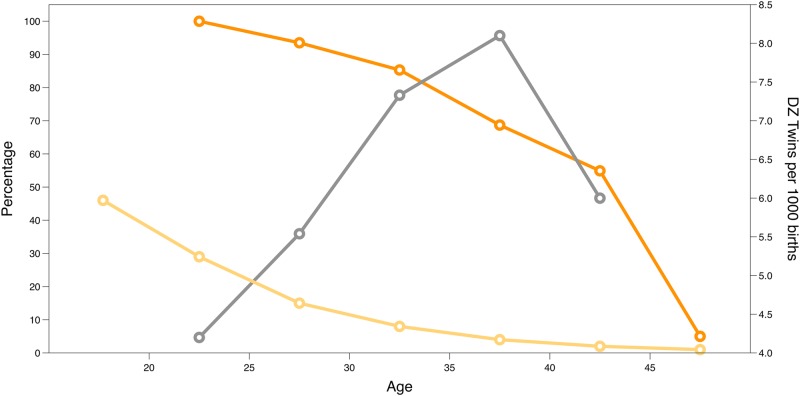
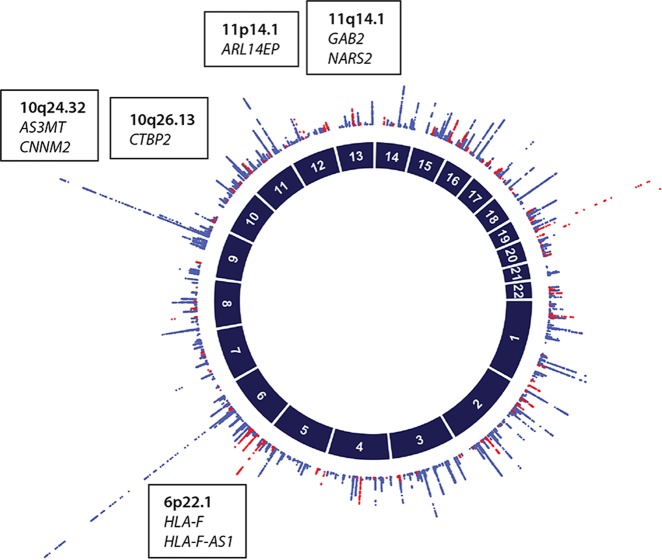
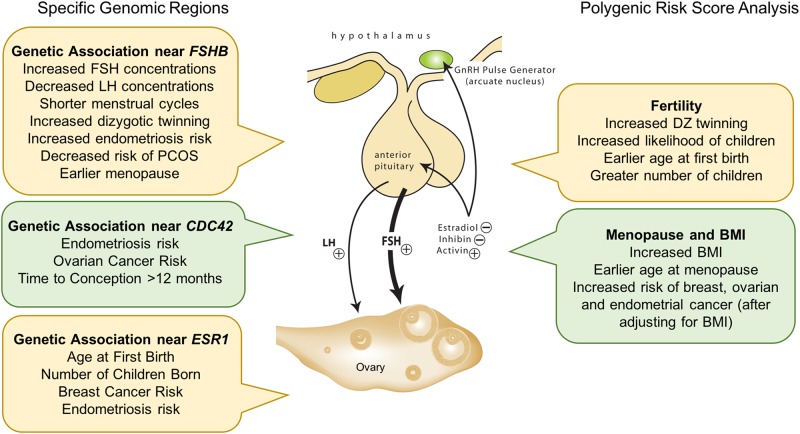
Variation in reproductive lifespan and female fertility have implications for health, population size and ageing. Fertility declines well before general signs of menopause and is also adversely affected by common reproductive diseases, including polycystic ovarian syndrome (PCOS) and endometriosis. Understanding the factors that regulate the timing of puberty and menopause, and the relationships with fertility are important for individuals and for policy. Substantial genetic variation exists for common traits associated with reproductive lifespan and for common diseases influencing female fertility. Genetic studies have identified mutations in genes contributing to disorders of reproduction, and in the last ten years, genome-wide association studies (GWAS) have transformed our understanding of common genetic contributions to these complex traits and diseases. These studies have made great progress towards understanding the genetic factors contributing to variation in traits and diseases influencing female fertility. The data emerging from GWAS demonstrate the utility of genetics to explain epidemiological observations, revealing shared biological pathways linking puberty timing, fertility, reproductive ageing and health outcomes. Many variants implicate DNA damage/repair genes in variation in the age at menopause with implications for follicle health and ageing. In addition to the discovery of individual genes and pathways, the increasingly powerful studies on common genetic risk factors help interpret the underlying relationships and direction of causation in the regulation of reproductive lifespan, fertility and related traits.


Conflict of interest statement

The authors declare no competing interests.

Figures

Fig. 1
Fig. 1
The number of significant association results for GWAS studies for reproductive traits (Y-axis—note the log scale) plotted as a function of the date of publication demonstrating progress in GWAS as increased sample sizes and improved genotyping arrays have increased the power of these studies to identity the large number of genetic factors contributing to variation in reproductive lifespan and reproductive diseases
Fig. 2
Fig. 2
The association between age and fertility (measured as the index of mean fertility rate by age classes with the fertility rate for the age class 20–24 set to 100%—dark orange line), ovarian reserve (percentage of ovarian reserve remaining at each age with 100% taken as the maximum ovarian reserve occurring at 18–22 weeks post-conception – pale orange line), and dizygotic twinning rate (dizygotic twins per 1000 births—grey line)
Fig. 3
Fig. 3
Circle plot showing chromosome number (dark blue, inner circle). Results of association between individual SNPs with Age at Menarche and Age at Menopause are plotted as –log10 (P values) (blue or red, outer circle). The red dots represent the associations with Age of Menopause above a threshold of p< 1 × 10−5 and the blue dots represent the associations with Age of Menarche above a threshold of p< 1 × 10−5. Genomic regions, where SNPs for Age at Menarche at genome-wide significance (p< 5 × 10−8) overlap with the genomic regions where SNPs for the Age at Menopause have suggestive evidence for association (p < 5 × 10−6) are identified on the figure within the text boxes including the chromosome region and nearby biological candidate genes
Fig. 4
Fig. 4
Genetic studies reveal several genomic regions with strong associations for multiple reproductive traits with three examples shown on the left-hand side of the figure. The Polygenic risk score (PRS) combines association results from genome-wide genotyping into a single estimate of the genetic risk for a disease or trait and is calculated from the number of risk alleles carried by an individual, weighted by the effect size estimated from the discovery sample. The polygenic risk scores calculated from the results of large GWAS data provide insights into shared genetic risk between traits and help to understand the complex relationships between related traits with two examples shown on the right-hand side of the figure. The examples are redrawn with permission from a figure published in Nature on age at menarche [Perry, J. R. et al.]

References

    1. Eshre Capri Workshop Group. Fertility and ag0eing. Hum. Reprod. Update. 2005;11:261–276. doi: 10.1093/humupd/dmi006. - DOI - PubMed
    1. Robson SL, Smith KR. Twinning in humans: maternal heterogeneity in reproduction and survival. Proc. Biol. Sci. 2011;278:3755–3761. doi: 10.1098/rspb.2011.0573. - DOI - PMC - PubMed
    1. Forman MR, Mangini LD, Thelus-Jean R, Hayward MD. Life-course origins of the ages at menarche and menopause. Adolesc. Health Med Ther. 2013;4:1. - PMC - PubMed
    1. Jensen MB, Priskorn L, Jensen TK, Juul A, Skakkebaek NE. Temporal trends in fertility rates: a nationwide registry based study from 1901 to 2014. PLOS ONE. 2015;10:e0143722. doi: 10.1371/journal.pone.0143722. - DOI - PMC - PubMed
    1. Aiken CE, Tarry-Adkins JL, Ozanne SE. Transgenerational developmental programming of ovarian reserve. Sci. Rep. 2015;5:16175. doi: 10.1038/srep16175. - DOI - PMC - PubMed