. 2018 Oct 17;4(10):eaat3386.
doi: 10.1126/sciadv.aat3386. eCollection 2018 Oct.

Targeted delivery of antisense oligonucleotides to pancreatic β-cells

Affiliations

Targeted delivery of antisense oligonucleotides to pancreatic β-cells

C Ämmälä et al. Sci Adv. .

Abstract

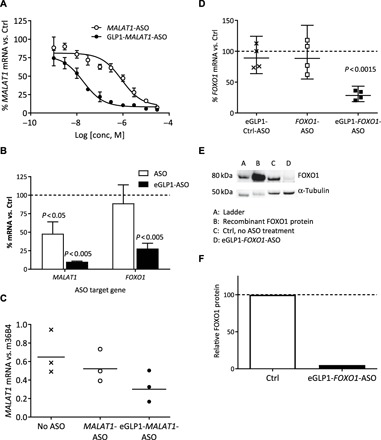
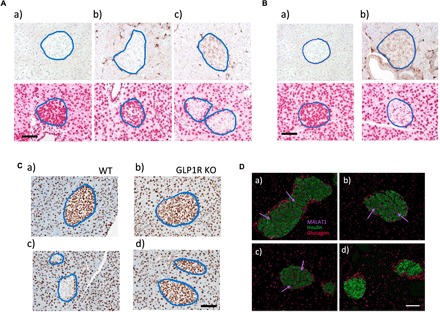
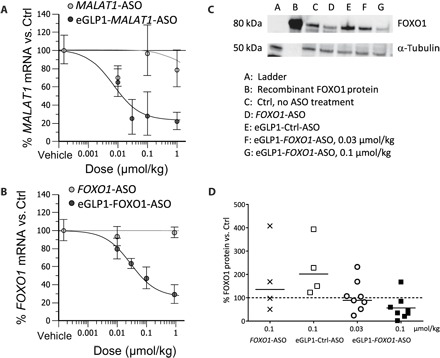
Antisense oligonucleotide (ASO) silencing of the expression of disease-associated genes is an attractive novel therapeutic approach, but treatments are limited by the ability to deliver ASOs to cells and tissues. Following systemic administration, ASOs preferentially accumulate in liver and kidney. Among the cell types refractory to ASO uptake is the pancreatic insulin-secreting β-cell. Here, we show that conjugation of ASOs to a ligand of the glucagon-like peptide-1 receptor (GLP1R) can productively deliver ASO cargo to pancreatic β-cells both in vitro and in vivo. Ligand-conjugated ASOs silenced target genes in pancreatic islets at doses that did not affect target gene expression in liver or other tissues, indicating enhanced tissue and cell type specificity. This finding has potential to broaden the use of ASO technology, opening up novel therapeutic opportunities, and presents an innovative approach for targeted delivery of ASOs to additional cell types.


Figures

Fig. 1
Fig. 1. Schematic structure of a fluorescently labeled eGLP1-conjugated MALAT1 ASO and internalization of fluorescent eGLP1 and eGLP1-MALAT1-ASO.
(A) Schematic structure of the Cy3-labeled eGLP1-MALAT1-ASO conjugate. (B) Fluorescence imaging of (a) wild-type and (b and c) GLP1R-HEK293 cells treated with 100 nM BODIPY–labeled (green) eGLP1 peptide for 15 min (b) or 60 min (a and c) at 37°C. (C) Fluorescence imaging of (a) wild-type and (b and c) GLP1R-HEK293 cells treated with 33 nM Cy3–labeled (red) eGLP1-MALAT1-ASO for 15 min at 0°C (b) or for 60 min at 37°C (a and c). Cells were stained, fixed, and imaged on an ImageXpress fluorescence microscope. Nuclei were stained with Hoechst 32585 (blue). Scale bars, 10 μm.
Fig. 2
Fig. 2. Characterizing GLP1R signaling pathways and pharmacology activated by eGLP1-MALAT1-ASO (•) and eGLP1-FOXO1-ASO (▪) compared to eGLP1 peptide (○) and exenatide (ρ).
(A) Displacement of 125I-GLP1 in membranes from GLP1R overexpressing HEK293. eGLP1-MALAT1-ASO (•) and eGLP1-FOXO1-ASO (▪) displaced 125I-GLP1 equally well as the eGLP1 peptide (○) and exenatide (ρ). Functional assays measuring G protein signaling by (B) DMR and (C) cAMP accumulation in GLP1R-HEK293 cells showed that eGLP1-MALAT1-ASO (•) and eGLP1-FOXO1-ASO (▪) were equally potent as the eGLP1 peptide (○) and exenatide (△), with only minor impact from conjugation of MALAT1-ASO and FOXO1-ASO to the eGLP1 peptide. (D) β-Arrestin2 recruitment in GLP1R-CHO-K1 and (E) receptor internalization in GLP1R-U2OS using PathHunter assays showed similar potencies for eGLP1, exenatide, and ASO-conjugated eGLP1, but with reduced maximal effect for both eGLP1-MALAT1-ASO (•) and eGLP1-FOXO1-ASO (▪). Data are presented as mean ± SEM using exenatide as reference for 100% effect. (F) Effect of 10 nM exenatide (ρ), eGLP1-Ctrl-ASO (x), FOXO1-ASO (□), eGLP1-FOXO1-ASO (▪), MALAT1-ASO (○), or eGLP1- MALAT1-ASO (•) on glucose GSIS in human reconstituted islet microtissues. Islets were treated with high glucose, and the compounds and insulin content were measured in the culture medium. Data were normalized to secretion at 11 mM glucose and presented as geometric mean ± 95% confidence interval (CI). Statistical analysis by one-way analysis of variance (ANOVA) adjusted for multiple comparisons.
Fig. 3
Fig. 3. Effects of ASO and eGLP1-ASO conjugates on gene expression and protein levels in vitro in cell lines and primary mouse islet cells.
(A) MALAT1 RNA measured in GLP1R-HEK293 cells treated overnight with increasing concentrations of either MALAT1-ASO (○) or eGLP1-MALAT1-ASO (•), and data were normalized to MALAT1 expression in untreated cells (Ctrl). Data are plotted as mean ± SD of six replicates. (B) MALAT1 and FOXO1 transcripts measured in primary mouse islets treated overnight with 1 μM MALAT1-ASO and 1 μM FOXO1-ASO (open bars), 1 μM eGLP1-MALAT1-ASO, and 1 μM eGLP1-FOXO1-ASO (closed bars), as indicated in the graph. Data were normalized to corresponding expression in untreated islets (Ctrl). Representative data from one of three independent experiments. (C) MALAT1 RNA measured in human islets treated with 1 μM MALAT1-ASO (○) and 1 μM eGLP1-MALAT1-ASO (•) and compared with expression in untreated islets (x). (D) FOXO1 mRNA measured in mouse islets treated for 96 hours with 1 μM eGLP1-Ctrl-ASO (x), 1 μM FOXO1-ASO (□), or 1 μM eGLP1-FOXO1-ASO (▪). Data were normalized to FOXO1 expression measured in untreated islets (Ctrl) and plotted as dot plots for individual animals and geometrical mean ± 95% CI. (E) FOXO1 protein levels in the islets by Western blot for the untreated and islets treated with 1 μM eGLP1-FOXO1-ASO for 96 hours. (F) Relative protein levels were quantified by normalizing the band intensity to α-tubulin, and only one biological replicate per treatment was evaluated (therefore having no statistical analysis).
Fig. 4
Fig. 4. GLP1R-dependent uptake of ASO and knockdown of gene expression in mice treated with eGLP1-ASO conjugates in vivo.
(A) Representative pancreatic sections stained for ASO by IHC and MALAT1 RNA by ISH from mice treated for 2 weeks with three subcutaneous injections of (a) saline, (b) MALAT1-ASO (1 μmol/kg), or (c) eGLP1-MALAT1-ASO (1 μmol/kg). (B) ASO uptake by IHC and MALAT1 RNA levels by ISH in pancreatic sections from mice treated for 2 weeks with three intravenous injections of (a) saline or (b) eGLP1-MALAT1-ASO (1 μmol/kg). (C) MALAT1 gene expression by ISH in (a) wild-type (WT) and (b) GLP1R knockout (KO) mice 72 hours after a single subcutaneous dose of saline or eGLP1-MALAT1-ASO (1 μmol/kg). (D) Pancreatic section from wild-type mice stained using fluorescence in situ probes for MALAT1 (purple, arrows), insulin (green), and glucagon (red). Pancreatic sections were collected 72 hours after one subcutaneous administration of (a) saline or (b) MALAT1-ASO and (c) eGLP1-control-ASO or (d) eGLP1-MALAT1-ASO, and all compounds were dosed at 1 μmol/kg. Scale bars, 200 μm. Islets are circled in blue in (A) to (C).
Fig. 5
Fig. 5. Dose-dependent silencing of gene expression and reduction in protein levels in mice treated with eGLP1-ASO conjugates in vivo.
(A) Target gene expression in islets isolated from mice 72 hours after single subcutaneous doses of MALAT1-ASO (○) or eGLP1-MALAT1-ASO (•). (B) Target gene expression in islets isolated from mice 72 hours after single subcutaneous doses of FOXO1-ASO (○) or eGLP1-FOXO1-ASO (•). Data in (A) and (B) were normalized to vehicle control and presented as mean ± SE (n = 6 per group), assuming log-normal distribution. Solid line corresponds to a Hill equation fitted to the experimental data. For visual assessment, the vehicle group is included in the graph at the point where the y axis intercepts the x axis. (C) Representative Western blot of islet homogenates from animals treated for 6 weeks with weekly subcutaneous injections of saline, FOXO1-ASO (0.1 μmol/kg), eGLP1-FOXO1-ASO (0.1 or 0.03 μmol/kg), or eGLP1-Ctrl-ASO (0.1 μmol/kg), showing FOXO1 protein levels. (D) FOXO1 protein levels in individual animals quantified relative to α-tubulin and normalized to the geometrical mean of untreated mice. Data were represented as scatter dot plots for individual mice and the geometrical mean for each treatment group.

References

    1. Valeur E., Guéret S. M., Adihou H., Gopalakrishnan R., Lemurell M., Waldmann H., Grossmann T. N., Plowright A. T., New modalities for challenging targets in drug discovery. Angew. Chem. Int. Ed. Engl. 56, 10294–10323 (2017). - PubMed
    1. Khvorova A., Watts J. K., The chemical evolution of oligonucleotide therapies of clinical utility. Nat. Biotechnol. 35, 238–248 (2017). - PMC - PubMed
    1. Stein C. A., Castanotto D., FDA-approved oligonucleotide therapies in 2017. Mol. Ther. 25, 1069–1075 (2017). - PMC - PubMed
    1. Wan W. B., Seth P. P., The medicinal chemistry of therapeutic oligonucleotides. J. Med. Chem. 59, 9645–9667 (2016). - PubMed
    1. Crooke S. T., Wang S., Vickers T. A., Shen W., Liang X.-h., Cellular uptake and trafficking of antisense oligonucleotides. Nat. Biotechnol. 35, 230–237 (2017). - PubMed

Publication types

MeSH terms

Substances

LinkOut - more resources