. 2018 Oct 16:1:167.
doi: 10.1038/s42003-018-0168-6. eCollection 2018.

Population genomic analyses of the chocolate tree, Theobroma cacao L., provide insights into its domestication process

Affiliations

Population genomic analyses of the chocolate tree, Theobroma cacao L., provide insights into its domestication process

Omar E Cornejo et al. Commun Biol. .

Abstract

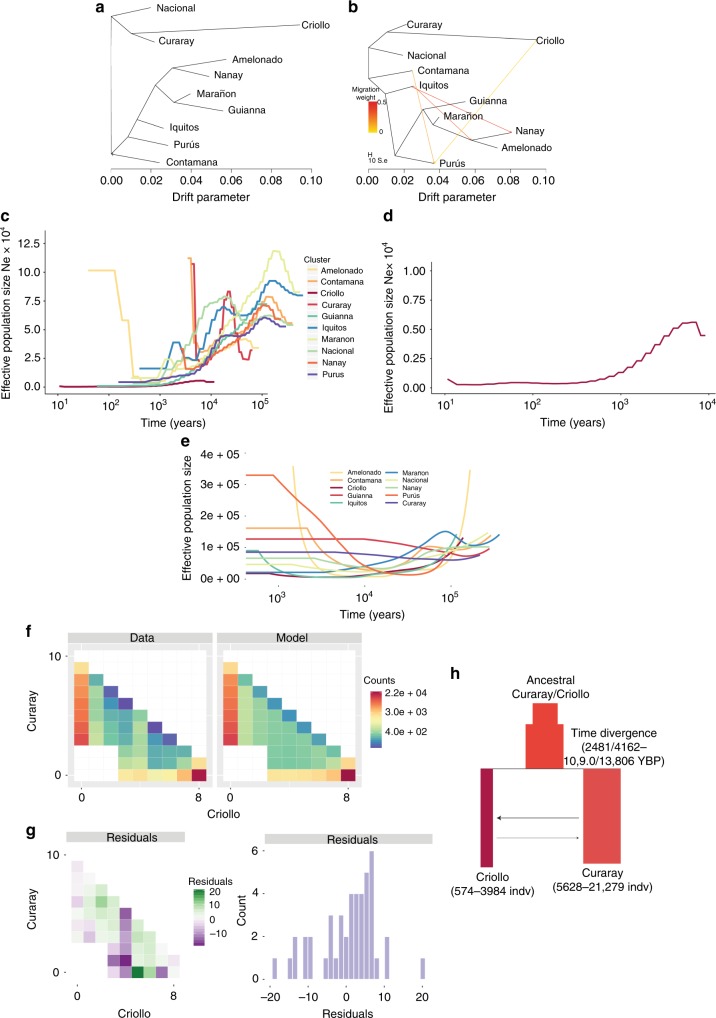
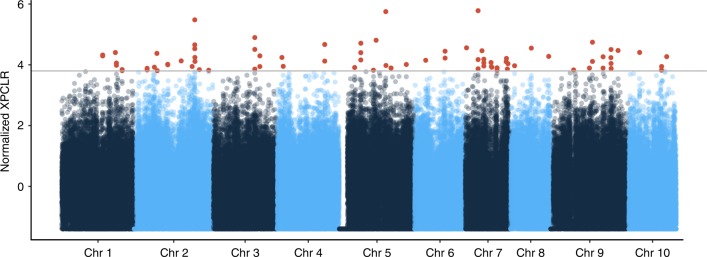
Domestication has had a strong impact on the development of modern societies. We sequenced 200 genomes of the chocolate plant Theobroma cacao L. to show for the first time to our knowledge that a single population, the Criollo population, underwent strong domestication ~3600 years ago (95% CI: 2481-13,806 years ago). We also show that during the process of domestication, there was strong selection for genes involved in the metabolism of the colored protectants anthocyanins and the stimulant theobromine, as well as disease resistance genes. Our analyses show that domesticated populations of T. cacao (Criollo) maintain a higher proportion of high-frequency deleterious mutations. We also show for the first time the negative consequences of the increased accumulation of deleterious mutations during domestication on the fitness of individuals (significant reduction in kilograms of beans per hectare per year as Criollo ancestry increases, as estimated from a GLM, P = 0.000425).


Conflict of interest statement

Co-authors Donald Livingstone III, Conrad Stack, Alberto Romero, Stefan Royaert, Osman Gutierrez, and Juan C. Motamayor are or have been employees of the funding agency MARS Inc. The authors declare no other competing financial or non-financial interests.

Figures

Fig. 1
Fig. 1
Genomic annotation of single-nucleotide polymorphism (SNPs) in T. cacao. a The number of SNPs categorized by functional impact in transcript variation per chromosome. b Details of the comparative number of synonymous and non-synonymous mutations
Fig. 2
Fig. 2
Population genetic structure in T. cacao. a The ten main genetic clusters can be recovered (A.1), although further structure (11 clusters) seems to be meaningful given that a considerable number of admixed individuals present the ancestry from a subset of Amelonado ancestry (A. 2). Color bars on top of the admixed individuals show our suggested grouping for the hybrids. b Map of Central and South America showing the median coordinate locations for the origin of samples from each population sampled in this work (with the exception of Admixed). c MDS showing a gradient of differentiation form the West to the East side of the Amazon (PC2) and a major separation of the Criollo group that corresponds to the Mesoamerican domesticated group (PC1). d Significant decay of genetic diversity (π) for the species along PC2 is supportive of the origin of the species being in the western side of the Amazon Basin (Criollo is excluded, model: π ∼ group + ε, p < 2E-16, r2 = 0.19). e All ten population genetic groups that have been described for the species are highly differentiated, with Criollo presenting a larger average FST when compared against all the other groups
Fig. 3
Fig. 3
Population Demographics of T. cacao. a Maximum likelihood tree generated by TreeMix using intergenic regions of whole-genome sequencing data from individuals belonging to each one of the 10 main genetic groups. b Maximum likelihood tree allowing for admixture, as generated by TreeMix, showing some of the most significant ancestral contributions (migrations) from and to other groups. c Changes in effective population sizes over time, inferred under the coalescent with PSMC, for each on the 10 genetic groups in cacao. Each line represents the within-population median estimate, smoothed by fitting a cubic spline. d Detail of PSMC effective population size reconstruction for Criollo cacao, represented at a different scale to better represent the population decline. e Changes in effective population sizes over time, inferred under the coalescent with SMC + + , for each on the 10 genetic groups in cacao. Different color lines correspond to each population. A similar trend of historical population reduction (albeit different magnitudes) was observed with the two methods. f Observed two-dimensional site frequency spectrum (SFS, left panel) for the Criollo/Curaray population pair and expected SFS (right panel) under the inferred demographic model depicted in g The colors correspond to magnitudes (number of SNPs in each minor allele frequency bins). Anscombe residuals (difference between observed and expected) per frequency bin (left panel) and as an overall distribution (right panel). h Diagram for the proposed demographic model to explain Criollo/Curaray divergence, a model of isolation with migration. The time progresses from top to bottom and horizontal size of the boxes are relative to the relative effective population size. The estimated migration is relatively higher going from Curaray to Criollo, yet the scale of recombination estimated from the model is small
Fig. 4
Fig. 4
Evidence of positive selection in domesticated T. cacao. Maximum likelihood approach for detecting regions of the genome that diverged significantly from the demographic depicted by the site frequency spectrum in Fig. 2e. Red points correspond to windows putatively under selection
Fig. 5
Fig. 5
Accumulation of deleterious mutations during domestication in T. cacao. a Distribution of coefficients of Inbreeding (F) per population (including the group of Admixed individuals). b Coefficients of Inbreeding as a function of the harmonic mean of the effective population size (estimated from the median PSMC shown in Fig. 2D, model: F ~ Ne+ Group, p < = 0.003, r2 = 0.9). c Distribution of deleterious/tolerated mutations inferred with SIFT for the Criollo and Amelonado groups for rare and two classes of common binned minor allele frequency classes showing the highest relative proportion of common deleterious and tolerated amino acid changes in Criollo. d Population structure inferred using a maximum likelihood under a supervised model for an independent set of genotyped individuals (see supplements) for which productivity has been measured. e Productivity (measured as Kg of beans per hectare per year) as a function of Criollo ancestry in the newly genotyped set of individuals; the results show a significant reduction in productivity as the proportion of Criollo ancestry increases, after correcting for inbreeding

References

    1. Childe, G. V. Social evolution. (Watts & Co, London, 1951).
    1. Diamond J. Evolution, consequences and future of plant and animal domestication. Nature. 2002;418:700–707. doi: 10.1038/nature01019. - DOI - PubMed
    1. Renaut S, Rieseberg LH. The accumulation of deleterious mutations as a consequence of domestication and improvement in sunflowers and other compositae crops. Mol. Biol. Evol. 2015;32:2273–2283. doi: 10.1093/molbev/msv106. - DOI - PubMed
    1. Wang GD, Xie HB, Peng MS, Irwin D, Zhang YP. Domestication genomics: evidence from animals. Annu Rev. Anim. Biosci. 2014;2:65–84. doi: 10.1146/annurev-animal-022513-114129. - DOI - PubMed
    1. Coe, S. D., Coe, M. D. & Huxtable, R. J. The true history of chocolate. (Thames and Hudson, New York, 1996).