. 2019 Sep;45(9):1599-1618.
doi: 10.1037/xlm0000664. Epub 2018 Oct 22.

Modeling memory dynamics in visual expertise

Affiliations

Modeling memory dynamics in visual expertise

Jeffrey Annis et al. J Exp Psychol Learn Mem Cogn. 2019 Sep.

Abstract

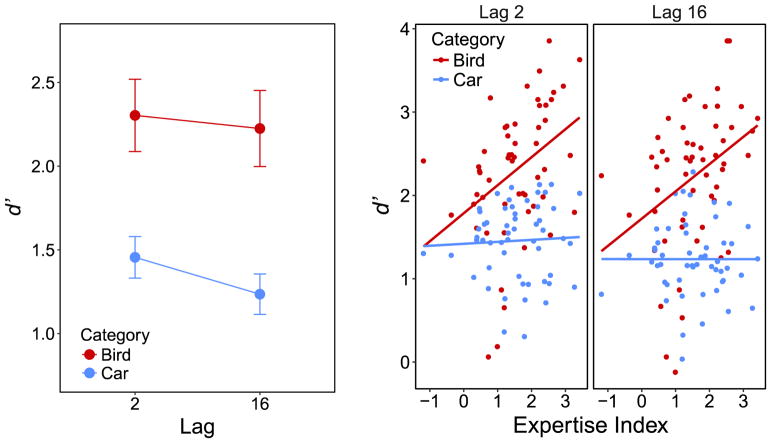
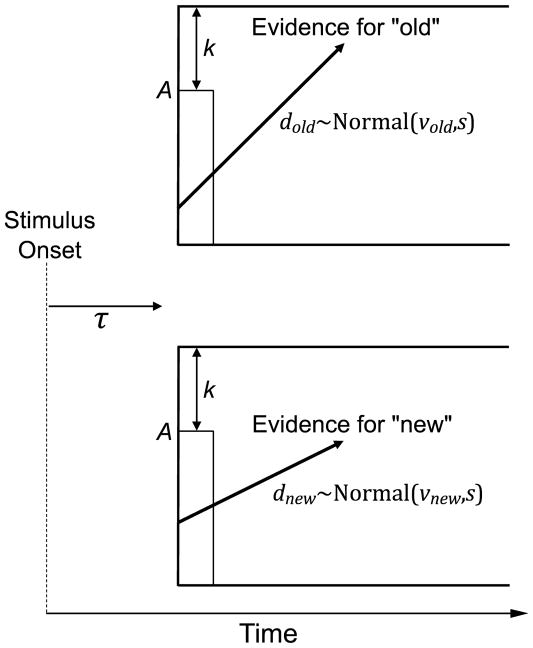
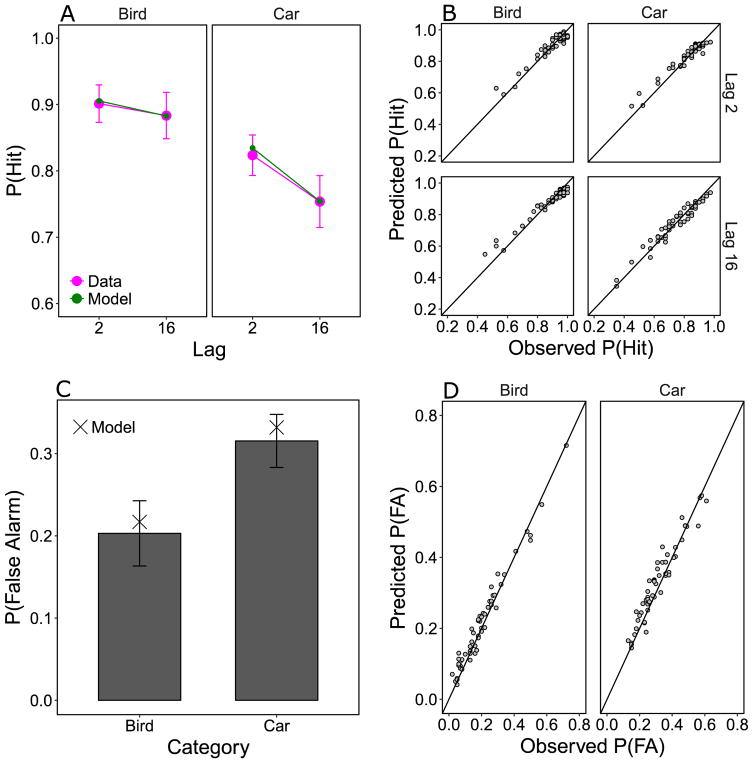
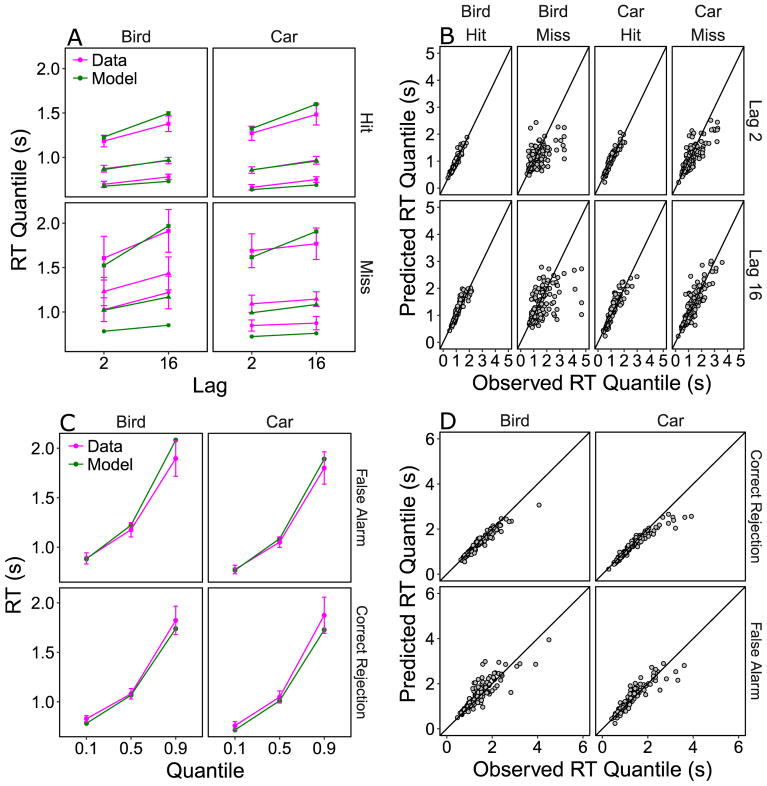
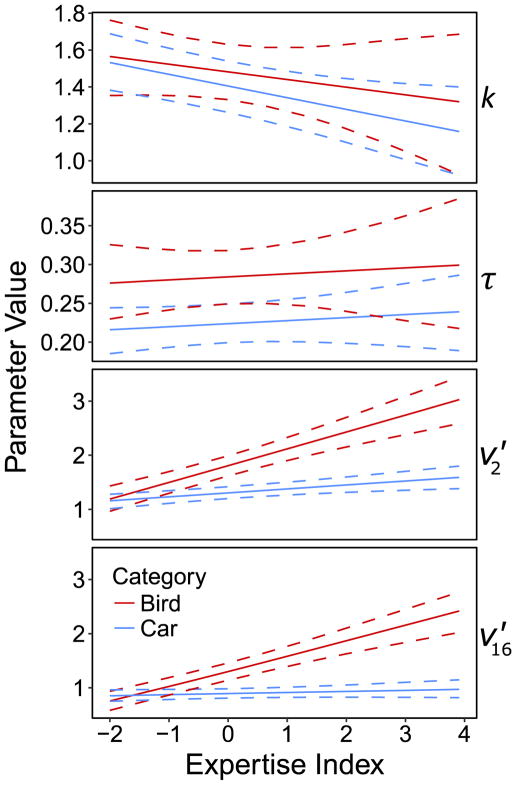
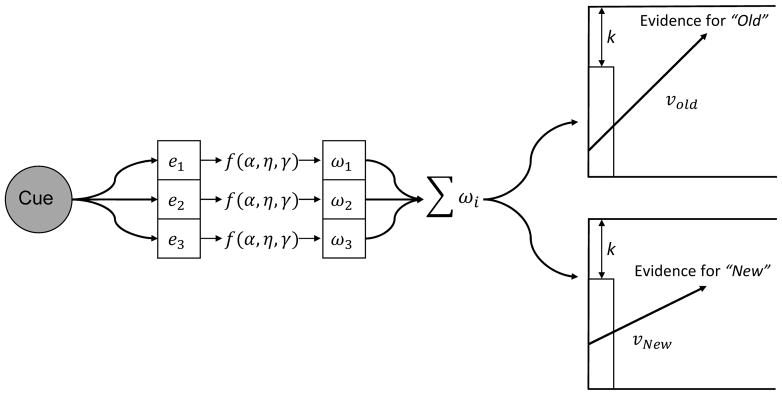
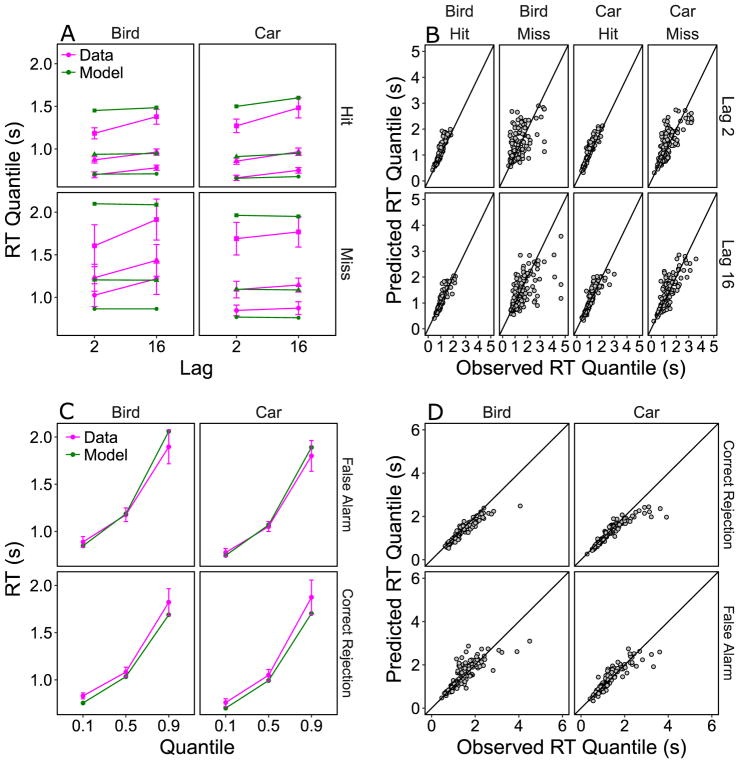
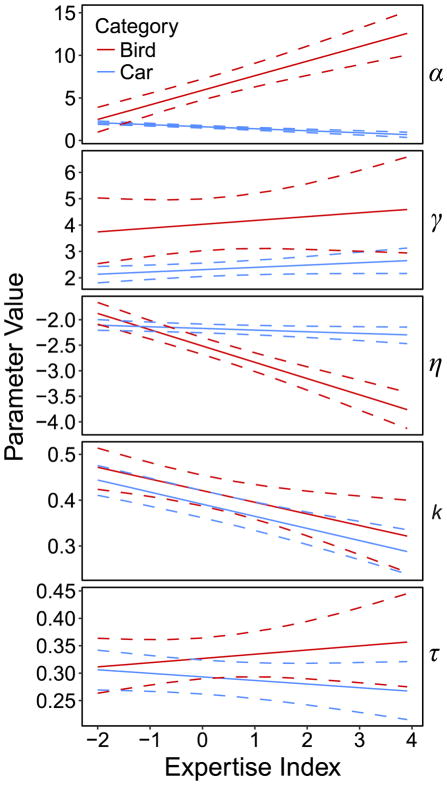
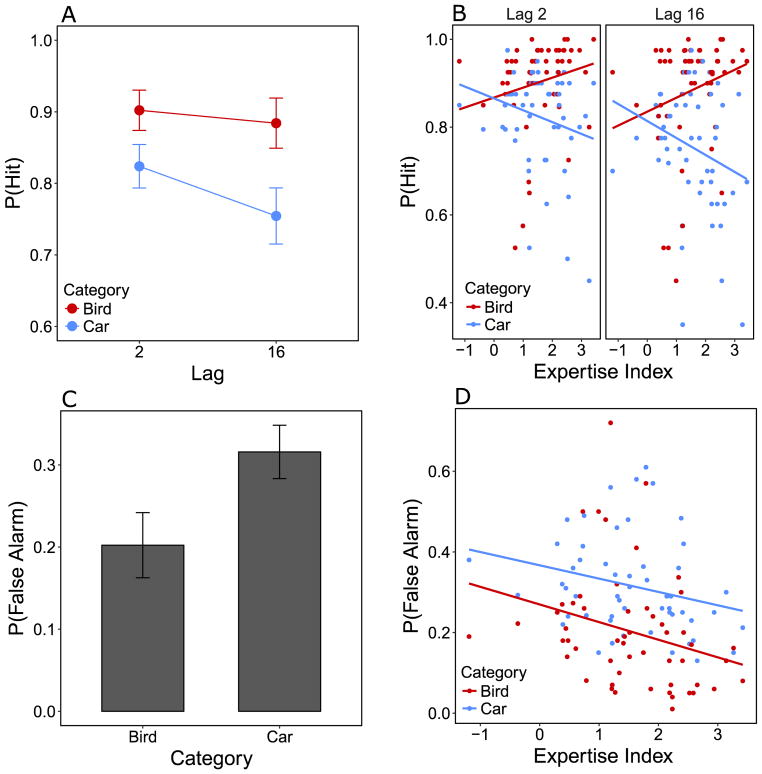
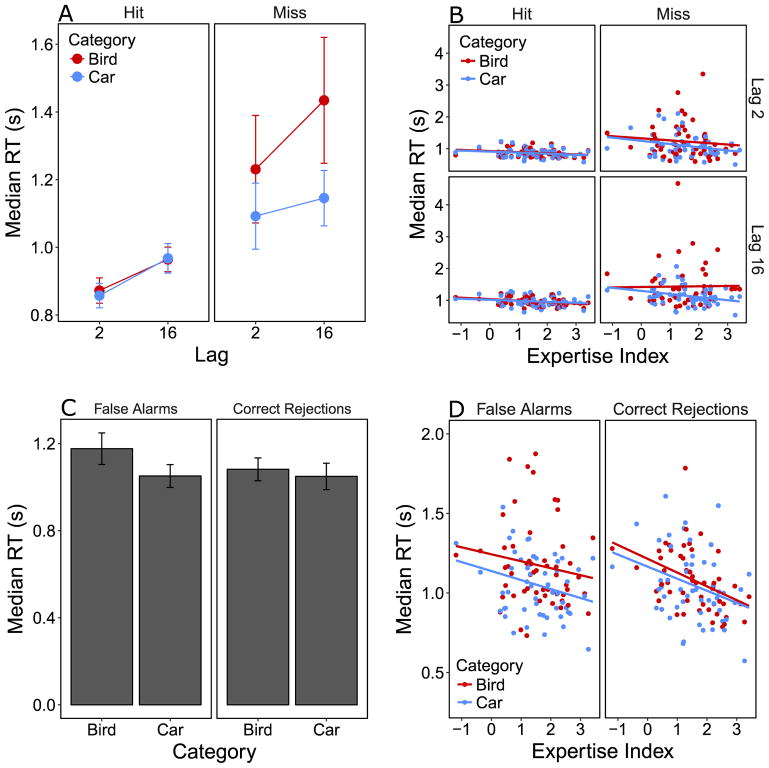
The development of visual expertise is accompanied by enhanced visual object recognition memory within an expert domain. We aimed to understand the relationship between expertise and memory by modeling cognitive mechanisms. Participants with a measured range of birding expertise were recruited and tested on memory for birds (expert domain) and cars (novice domain). Participants performed an old-new continuous recognition memory task whereby on each trial an image of a bird or car was presented that was either new or had been presented earlier with lag j. The Linear Ballistic Accumulator model (LBA; Brown & Heathcote, 2008) was first used to decompose accuracy and response time (RT) into drift rate, response threshold, and nondecision time, with the measured level of visual expertise as a potential covariate on each model parameter. An Expertise × Category interaction was observed on drift rates such that expertise was positively correlated with memory performance recognizing bird images but not car images as old versus new. To then model the underlying processes responsible for variation in drift rate with expertise, we used a model of drift rates building on the Exemplar-Based Random Walk model (Nosofsky, Cox, Cao, & Shiffrin, 2014; Nosofsky & Palmeri, 1997), which revealed that expertise was associated with increases in memory strength and increases in the distinctiveness of stored exemplars. Taken together, we provide insight using formal cognitive modeling into how improvements in recognition memory with expertise are driven by enhancements in the representations of objects in an expert domain. (PsycINFO Database Record (c) 2019 APA, all rights reserved).


Figures

Figure 1
Figure 1
The left panel plots d′ as a function of lag and category. The right panel shows d′ for each participant as a function of expertise index and lag for each category.
Figure 2
Figure 2
The Linear Ballistic Accumulator model. After stimulus presentation, the stimulus is perceptually encoded with time τ, and evidence begins to accumulate towards either the old or new response. The rate at which evidence accumulates for each response type is given by the drift rates, dold and dnew. The drift rates are assumed to be drawn from corresponding normal distribution with mean vold or vnew and standard deviation s. The LBA assumes that the starting point of each accumulator varies from trial to trial, where the starting point is drawn from a uniform distribution from 0 to A. The response threshold is given by A + k, where k is referred to as the relative threshold. When an accumulation process reaches its threshold, the corresponding old or new response is made.
Figure 3
Figure 3
Panel A shows group-level fits of the LBA to the hit rates as a function of lag. Panel B shows predicted hit rates plotted as a function observed hit rates for each participant. Panel C shows fits of the model to false alarm rates for each category. Panel D shows the predicted false alarm rates as a function of the observed false alarm rates for each participant.
Figure 4
Figure 4
Panel A shows group-level fits of the LBA to the hit rates as a function of lag. Panel B shows predicted hit rates plotted as a function observed hit rates for each participant. Panel C shows fits of the model to false alarm rates for each category. Panel D shows the predicted false alarm rates as a function of the observed false alarm rates for each participant.
Figure 5
Figure 5
Solid lines show the mean posterior predicted value for each key parameter of the LBA as a function of the expertise index for each category. Dotted lines show the 95% highest density interval. Parameter meanings: k: response threshold; τ: non-decision time; v2: difference in drift rate between new items and old items at lags of 2; v16: difference in drift rate between new items and old items at lags of 16.
Figure 6
Figure 6
A graphical representation of the EBRW model for continuous recognition. The cue is matched in parallel to the activated set of stored exemplars, shown here as e1, e2, and e3. The matching process results in an activation value for each exemplar, shown here as ω1, ω2 and ω3. These activations are a joint function of the overall memory strength of the stored exemplar, α, the similarity between the cue and exemplar, s, and the amount of memory decay that has occurred since storage, γ. These activations are then summed and normalized, which is then used as the mean drift rate in the accumulator for the “old” response. The mean of the new drifts rate is computed by subtracting the sum of the activations from 1.
Figure 7
Figure 7
Panel A shows group-level fits of the EBRW to the hit rates as a function of lag. Panel B shows predicted hit rates plotted as a function observed hit rates for each participant. Panel C shows fits of the model to false alarm rates for each category. Panel D shows the predicted false alarm rates as a function of the observed false alarm rates for each participant.
Figure 8
Figure 8
Panel A shows group-level fits of the EBRW to hit and miss RT quantiles (10%, 50%, 90%) as a function of lag. Quantiles Panel B shows predicted hit and miss RTs plotted as a function observed hit rates for each participant. Panel C shows fits of the model to false alarm and correct rejection RT quantiles for each category. Panel D shows the predicted individual-level RT quantiles as a function of the observed quantile for each participant.
Figure 9
Figure 9
Solid lines show the mean posterior predicted value for each key parameter of the EBRW as a function of the expertise index for each category. Dotted lines show the 95% highest density interval. Parameter meanings: α: overall memory strength; γ: memory decay; η: similarity, k: response threshold; τ: non-decision time.
Figure A1
Figure A1
Panel A shows the hit rate as a function of lag and category. Panel B shows the individual-level hit rates as a function of expertise index and lag for each category with simple linear regression lines. Panel C shows the false alarm rates as a function category and Panel D shows the false alarm rates as a function of expertise index and category with regression lines.
Figure A2
Figure A2
Panel A shows the median hit and miss RTs as a function lag and category. Panel B shows the participant-level median hit and miss RTs as function of their expertise index for each category and lag. Lines represent simple linear regression lines. Panel C shows the median false alarm and correct rejection RTs as a function of category. Panel D shows the participant-level false alarm and correct rejections as a function of their expertise index for each category.

Similar articles

Cited by

References

    1. Annis J, Miller BJ, Palmeri TJ. Bayesian inference with Stan: A tutorial on adding custom distributions. Behavior Research Methods. 2017;49:863–886. doi: 10.3758/s13428-016-0746-9. - DOI - PMC - PubMed
    1. Annis J, Palmeri TJ. Bayesian statistical approaches to evaluating cognitive models. Wiley Interdisciplinary Reviews: Cognitive Science. 2018 doi: 10.1002/wcs.1458. - DOI - PMC - PubMed
    1. Ashby FG. A stochastic version of general recognition theory. Journal of Mathematical Psychology. 2000;44(2):310–329. doi: 10.1006/jmps.1998.1249. - DOI - PubMed
    1. Baker J, Côté J, Abernehty B. Sport-specific practice and the development of expert decision-making in team ball sports. Journal of Applied Sport Psychology. 2003;15:12–25. doi: 10.1080/10413200390180035. - DOI
    1. Brown SD, Heathcote A. The simplest complete model of choice response time: Linear ballistic accumulation. Cognitive Psychology. 2008;57(3):153–178. doi: 10.1016/j.cogpsych.2007.12.002. - DOI - PubMed