Controlling Dispersion during Single-Cell Polyacrylamide-Gel Electrophoresis in Open Microfluidic Devices
- PMID: 30346747
- PMCID: PMC6777840
- DOI: 10.1021/acs.analchem.8b03233
Controlling Dispersion during Single-Cell Polyacrylamide-Gel Electrophoresis in Open Microfluidic Devices
Abstract
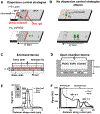
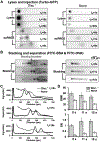
New tools for measuring protein expression in individual cells complement single-cell genomics and transcriptomics. To characterize a population of individual mammalian cells, hundreds to thousands of microwells are arrayed on a polyacrylamide-gel-coated glass microscope slide. In this "open" fluidic device format, we explore the feasibility of mitigating diffusional losses during lysis and polyacrylamide-gel electrophoresis (PAGE) through spatial control of the pore-size of the gel layer. To reduce in-plane diffusion-driven dilution of each single-cell lysate during in-microwell chemical lysis, we photopattern and characterize microwells with small-pore-size sidewalls ringing the microwell except at the injection region. To reduce out-of-plane-diffusion-driven-dilution-caused signal loss during both lysis and single-cell PAGE, we scrutinize a selectively permeable agarose lid layer. To reduce injection dispersion, we photopattern and study a stacking-gel feature at the head of each <1 mm separation axis. Lastly, we explore a semienclosed device design that reduces the cross-sectional area of the chip, thus reducing Joule-heating-induced dispersion during single-cell PAGE. As a result, we observed a 3-fold increase in separation resolution during a 30 s separation and a >2-fold enhancement of the signal-to-noise ratio. We present well-integrated strategies for enhancing overall single-cell-PAGE performance.
Figures


Similar articles
-
Ferguson analysis of protein electromigration during single-cell electrophoresis in an open microfluidic device.Analyst. 2020 May 21;145(10):3732-3741. doi: 10.1039/c9an02553g. Epub 2020 Apr 29. Analyst. 2020. PMID: 32347219 Free PMC article.
-
Joule Heating-Induced Dispersion in Open Microfluidic Electrophoretic Cytometry.Anal Chem. 2017 Dec 5;89(23):12787-12796. doi: 10.1021/acs.analchem.7b03096. Epub 2017 Nov 15. Anal Chem. 2017. PMID: 29110464
-
Geometry-induced injection dispersion in single-cell protein electrophoresis.Anal Chim Acta. 2018 Feb 13;1000:214-222. doi: 10.1016/j.aca.2017.11.049. Epub 2017 Nov 23. Anal Chim Acta. 2018. PMID: 29289313
-
Single-Cell Western Blotting.Methods Mol Biol. 2015;1346:1-9. doi: 10.1007/978-1-4939-2987-0_1. Methods Mol Biol. 2015. PMID: 26542711
-
In Situ Single-Cell Western Blot on Adherent Cell Culture.Angew Chem Int Ed Engl. 2019 Sep 23;58(39):13929-13934. doi: 10.1002/anie.201906920. Epub 2019 Aug 21. Angew Chem Int Ed Engl. 2019. PMID: 31390130 Free PMC article. Review.
Cited by
-
Electrotransfer of Immunoprobes through Thin-Layer Polyacrylamide Gels.Anal Chem. 2022 Feb 15;94(6):2706-2712. doi: 10.1021/acs.analchem.1c03919. Epub 2022 Feb 3. Anal Chem. 2022. PMID: 35113539 Free PMC article.
-
Harnessing Joule heating in microfluidic thermal gel electrophoresis to create reversible barriers for cell enrichment.Electrophoresis. 2021 Jun;42(11):1238-1246. doi: 10.1002/elps.202000379. Epub 2021 Feb 26. Electrophoresis. 2021. PMID: 33570796 Free PMC article.
-
Challenging Bioanalyses with Capillary Electrophoresis.Anal Chem. 2020 Jan 7;92(1):49-66. doi: 10.1021/acs.analchem.9b04718. Epub 2019 Dec 2. Anal Chem. 2020. PMID: 31698907 Free PMC article. Review.
-
Semi-Automatic Lab-on-PCB System for Agarose Gel Preparation and Electrophoresis for Biomedical Applications.Micromachines (Basel). 2021 Sep 2;12(9):1071. doi: 10.3390/mi12091071. Micromachines (Basel). 2021. PMID: 34577715 Free PMC article.
-
A comprehensive review on advancements in tissue engineering and microfluidics toward kidney-on-chip.Biomicrofluidics. 2022 Aug 16;16(4):041501. doi: 10.1063/5.0087852. eCollection 2022 Jul. Biomicrofluidics. 2022. PMID: 35992641 Free PMC article. Review.
References
-
- Hanahan D; Weinberg RA Cell 2011, 144, 646–674. - PubMed
-
- Schulz KR; Danna EA; Krutzik PO; Nolan GP Curr. Protoc. Immunol. 2012, 96, 8.17.1–8.17.20. - PubMed
-
- Stack EC; Wang C; Roman KA; Hoyt CC Methods 2014, 70, 46–58. - PubMed
-
- Perfetto SP; Chattopadhyay PK; Roederer M Nat. Rev. Immunol. 2004, 4, 648–655. - PubMed
Publication types
MeSH terms
Substances
Grants and funding
LinkOut - more resources
Full Text Sources
Research Materials

