. 2018 Oct 22;16(10):e2006247.
doi: 10.1371/journal.pbio.2006247. eCollection 2018 Oct.

The microRNA-29/PGC1α regulatory axis is critical for metabolic control of cardiac function

Affiliations

The microRNA-29/PGC1α regulatory axis is critical for metabolic control of cardiac function

Xurde M Caravia et al. PLoS Biol. .

Abstract

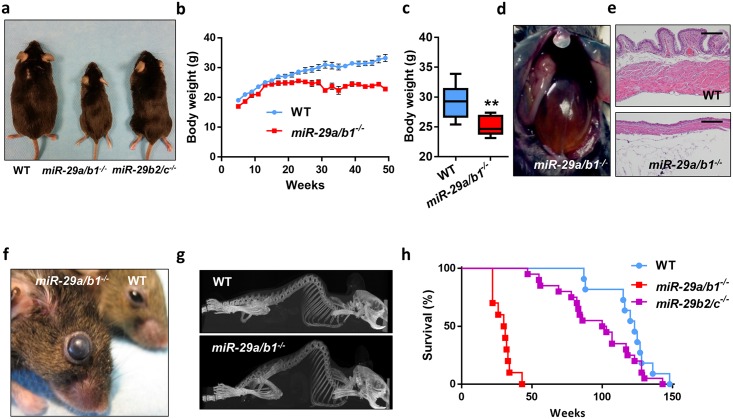
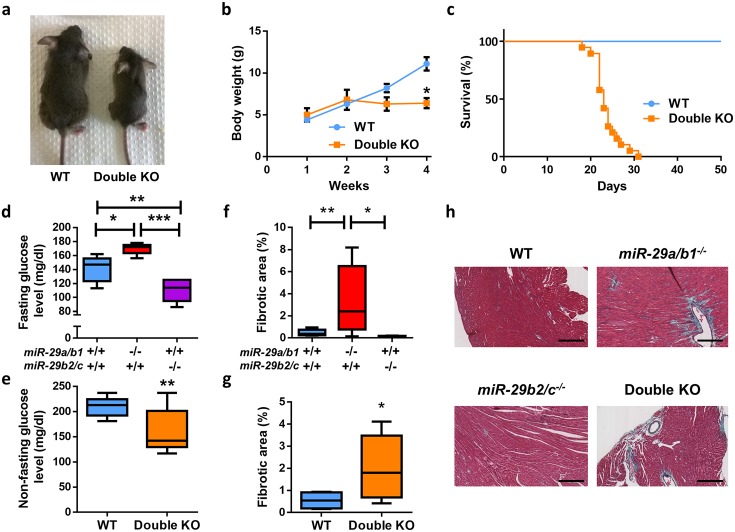
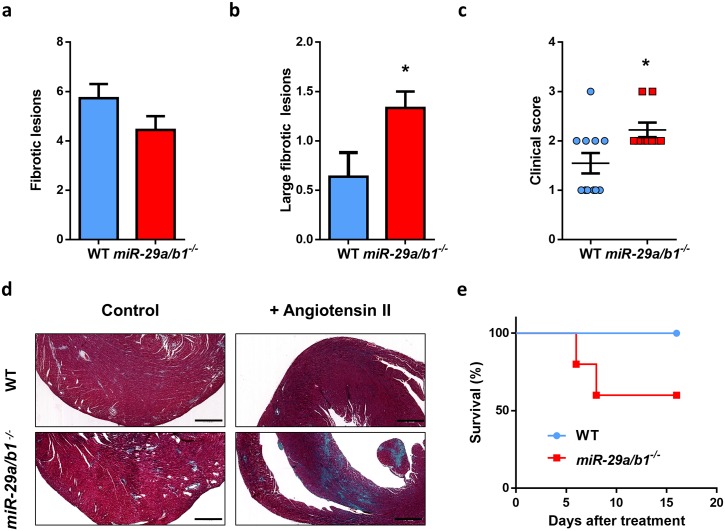
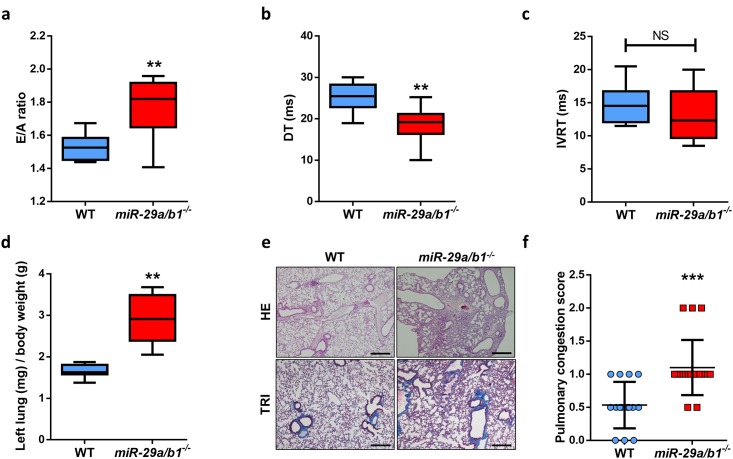
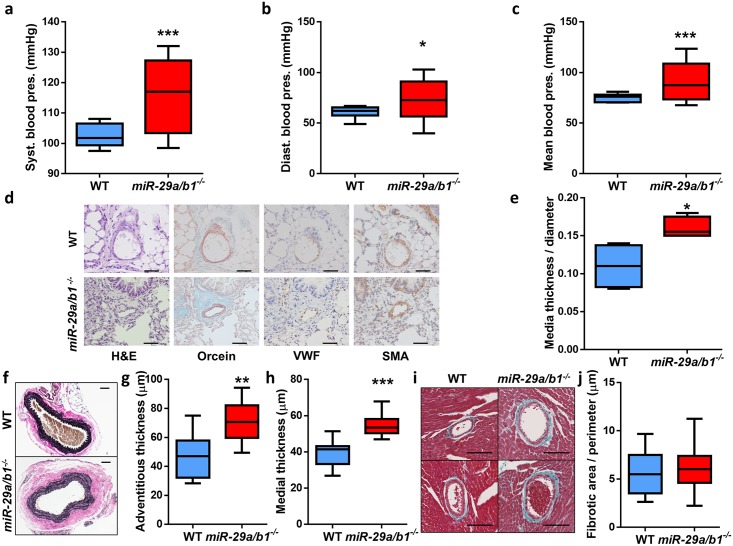
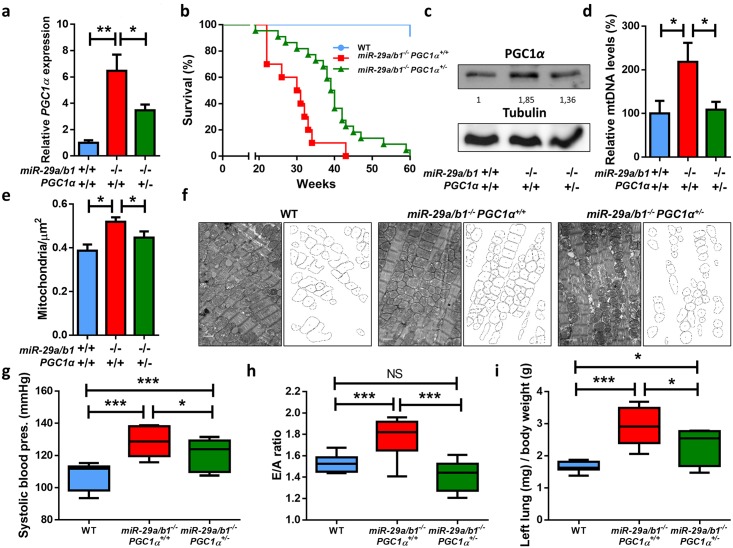
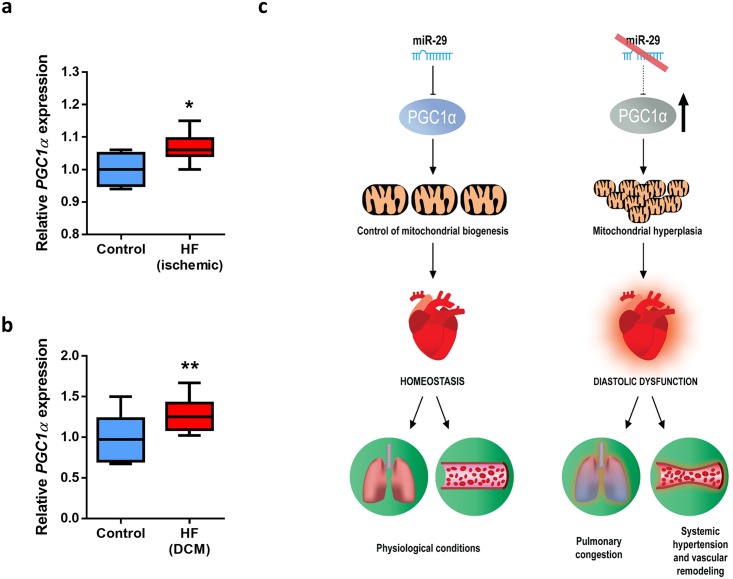
Different microRNAs (miRNAs), including miR-29 family, may play a role in the development of heart failure (HF), but the underlying molecular mechanisms in HF pathogenesis remain unclear. We aimed at characterizing mice deficient in miR-29 in order to address the functional relevance of this family of miRNAs in the cardiovascular system and its contribution to heart disease. In this work, we show that mice deficient in miR-29a/b1 develop vascular remodeling and systemic hypertension, as well as HF with preserved ejection fraction (HFpEF) characterized by myocardial fibrosis, diastolic dysfunction, and pulmonary congestion, and die prematurely. We also found evidence that the absence of miR-29 triggers the up-regulation of its target, the master metabolic regulator PGC1α, which in turn generates profound alterations in mitochondrial biogenesis, leading to a pathological accumulation of small mitochondria in mutant animals that contribute to cardiac disease. Notably, we demonstrate that systemic hypertension and HFpEF caused by miR-29 deficiency can be rescued by PGC1α haploinsufficiency, which reduces cardiac mitochondrial accumulation and extends longevity of miR-29-mutant mice. In addition, PGC1α is overexpressed in hearts from patients with HF. Collectively, our findings demonstrate the in vivo role of miR-29 in cardiovascular homeostasis and unveil a novel miR-29/PGC1α regulatory circuitry of functional relevance for cell metabolism under normal and pathological conditions.


Conflict of interest statement

The authors have declared that no competing interests exist.

Figures

Fig 1
Fig 1. Phenotypic characterization of miR-29–deficient mice.
(A) Representative picture of 8-month-old wild-type, miR-29a/b1−/−, and miR-29b2/c−/− mice. (B) Body weight curves of wild-type (n = 9) and miR-29a/b1−/− (n = 7) male mice (p < 0.05 from 25 to 49 weeks, two-tailed multiple Student t test, Bonferroni-corrected). (C) Body weight of 25-week-old wild-type (n = 9) and miR-29a/b1−/− (n = 7) male mice. (D) Representative picture showing the urinary retention phenotype of 9-month-old miR-29a/b1−/− mice. (E) HE sections of bladders of 7-month-old wild-type and miR-29a/b1−/− mice (original magnification: ×4, scale bar: 200 μm). (F) Representative picture of the eyes of 9-month-old wild-type and miR-29a/b1−/− mice. (G) CT scan of 7-month-old wild-type and miR-29a/b1−/− female mice. (H) Kaplan-Meier survival plot of wild-type (n = 11), miR-29a/b1−/− (n = 10), and miR-29b2/c−/− (n = 20) mice (p < 0.0001 for the comparison between wild-type and miR-29a/b1−/− mice; log-rank/Mantel-Cox test). Original raw data can be found in S1 Data file. CT, computed tomography; HE, hematoxylin–eosin; WT, wild-type.
Fig 2
Fig 2. Cardiometabolic alterations of miR-29–deficient mice.
(A) Representative picture of 22-day-old wild-type and double KO mice. (B) Body weight curves of wild-type (n = 15) and double KO (n = 3) mice (p < 0.05 at 4 weeks, two-tailed multiple Student t test, Bonferroni-corrected). (C) Kaplan–Meier survival plot of wild-type (n = 11) and double KO (n = 19) mice (p < 0.0001; log-rank/Mantel-Cox test). (D) Fasting blood glucose level in wild-type (n = 10), miR-29a/b1−/− (n = 5), and miR-29b2/c−/− (n = 6) mice. (E) Nonfasting blood glucose levels in wild-type (n = 9) and double KO (n = 12) mice (two-tailed Student t test with Welch’s correction). (F) Percentage of collagen present in cardiac sections of wild-type (n = 12), miR-29a/b1−/− (n = 8), and miR-29b2/c−/− (n = 5) mice. (G) Percentage of collagen present in cardiac sections of wild-type (n = 4) and double KO (n = 10) mice (two-tailed Student t test with Welch’s correction). (H) Gomori’s trichrome stained heart sections of wild-type, miR-29a/b1−/−, miR-29b2/c−/−, and double KO mice (original magnification: ×10, scale bar: 200 μm). Original raw data can be found in S1 Data file. KO, knock-out; WT, wild-type.
Fig 3
Fig 3. miR-29a/b1−/− mice display increased susceptibility to angiotensin II–induced cardiac fibrosis.
(A) Median of fibrotic lesions, (B) large fibrotic lesions, and (C) clinical score (grade 0: no fibrotic areas; grade 1: less than 25%; grade 2: from 26% to 50%; grade 3: from 51% to 75%; and grade 4: more than 76% of myocardium affected) in 3-month-old wild-type (n = 11) and miR-29a/b1−/− (n = 9) mice. (D) Representative micrographs of wild-type and miR-29a/b1−/− mice treated with angiotensin-II for 6 days (Gomori’s trichrome staining, original magnification: ×4, scale bar: 500 μm). (E) Kaplan–Meier survival plot of wild-type (n = 5) and miR-29a/b1−/− (n = 5) mice treated with angiotensin-II for 6 days. Original raw data can be found in S1 Data file. WT, wild-type.
Fig 4
Fig 4. miR-29a/b1−/− mice develop HFpEF.
(A) Quantification of E/A fraction in wild-type (n = 10) and miR-29a/b1−/− (n = 9) mice (two-tailed Student t test with Welch’s correction). (B) Quantification of DT of early filling in wild-type (n = 10) and miR-29a/b1−/− (n = 9) mice. (C) Quantification of IVRT in wild-type (n = 10) and miR-29a/b1−/− (n = 9) mice. (D) Ratio of left lung weight to body weight in wild-type (n = 8) and miR-29a/b1−/− (n = 5) mice (two-tailed Student t test with Welch’s correction). (E) HE and Masson’s trichrome stained lung sections of wild-type and miR-29a/b1−/− mice (original magnification: ×4, scale bar: 500 μm). (F) Clinical score of pulmonary congestion in wild-type (n = 15) and miR-29a/b1−/− (n = 20) mice. Original raw data can be found in S1 Data file. DT, deceleration time; E/A, early and late diastolic filling velocities ratio; HE, hematoxylin–eosin; HFpEF, heart failure with preserved ejection fraction; IVRT, isovolumetric relaxation time; NS, non-significant; TRI, Masson’s trichrome; WT, wild-type.
Fig 5
Fig 5. Systemic hypertension and vascular remodeling in miR-29a/b1−/− mice.
(A) Systolic, (B) diastolic, and (C) mean blood pressure values from wild-type (n = 10) and miR-29a/b1−/− (n = 8) mice. (D) Hematoxylin–eosin (HE), orcein for elastic fibers (Orcein), von Willebrand factor (VWF), and α-smooth muscle actin (SMA) staining of small pulmonary lung vessels (<50 μm) of wild-type and miR-29a/b1−/− mice (original magnification: ×40, scale bars: 50 μm). (E) Quantification of media layer thickness/diameter ratio of five SMA-stained small pulmonary blood vessels per mouse in wild-type (n = 4) and miR-29a/b1−/− (n = 4) mice. (F) Micrographs of Verhoeff–Van Gieson elastic staining of aortas from representative wild-type and miR-29a/b1−/− mice (original magnification: ×10, scale bar: 50 μm). (G) Thickness of the aortic adventitia layer of wild-type (n = 10) and miR-29a/b1−/− mice (n = 11). (H) Thickness of the aortic media layer of wild-type (n = 9) and miR-29a/b1−/− (n = 11) mice. (I) Representative micrographs of coronary arteries stained with Masson’s trichrome of wild-type and miR-29a/b1−/− mice (original magnification: ×20, scale bars: 100 μm). (J) Quantification of the surrounding fibrotic area/perimeter ratio of six coronary arteries per mouse in wild-type (n = 4) and miR-29a/b1−/− (n = 9) mice. Original raw data can be found in S1 Data file. Diast., diastolic; HE, hematoxylin–eosin; Orcein, orcein for elastic fibers; pres., pressure; SMA, α-smooth muscle actin; Syst., systolic; VWF, von Willebrand factor; WT, wild-type.
Fig 6
Fig 6. PGC1α is up-regulated in miR-29a/b1−/− mice, and its reduction extends life span and rescues cardiovascular pathology.
(A) PGC1α expression in hearts from wild-type (n = 7), miR-29a/b1−/− PGC1α+/+ (n = 13), and miR-29a/b1−/− PGC1α+/− (n = 7) mice. (B) Kaplan–Meier survival plot of wild-type (n = 11), miR-29a/b1−/− PGC1α+/+ (n = 10), and miR-29a/b1−/− PGC1α+/− (n = 22) mice (p < 0.01 for the comparison between miR-29a/b1−/− PGC1α+/+ and miR-29a/b1−/− PGC1α+/− mice; log-rank/Mantel-Cox test Bonferroni-corrected for multiple comparisons). (C) Western blot of PGC1α in hearts from wild-type, miR-29a/b1−/− PGC1α+/+, and miR-29a/b1−/− PGC1α+/− mice (relative densitometric quantification represented as arbitrary units). (D) Analysis of mtDNA quantity expressed as a percentage of levels in wild-type (n = 6), miR-29a/b1−/− PGC1α+/+ (n = 4), and miR-29a/b1−/− PGC1α+/− (n = 6) mice. (E) Number of mitochondria per μm2 in wild-type (six micrographs from two different mice), miR-29a/b1−/− PGC1α+/+ (22 micrographs from four different mice), and miR-29a/b1−/− PGC1α+/− (22 micrographs from three different mice) animals. (F) Electron micrographs and schematic representation of mitochondria of hearts from wild-type, miR-29a/b1−/− PGC1α+/+, and miR-29a/b1−/− PGC1α+/− mice (original magnification: ×15.000, scale bar: 1 μm). (G) Systolic blood pressure values from wild-type (n = 10), miR-29a/b1−/− PGC1α+/+ (n = 8), and miR-29a/b1−/− PGC1α+/− (n = 6) mice. (H) Quantification of E/A fraction in wild-type (n = 10), miR-29a/b1−/− PGC1α+/+ (n = 9), and miR-29a/b1−/− PGC1α+/− (n = 6) mice. (I) Ratio of left lung weight to body weight in wild-type (n = 8), miR-29a/b1−/− PGC1α+/+ (n = 5), and miR-29a/b1−/− PGC1α+/− (n = 5) mice. Original raw data can be found in S1 Data file. E/A, early and late diastolic filling velocities ratio; mtDNA, mitochondrial DNA; NS, non-significant; WT, wild-type.
Fig 7
Fig 7. PGC1α is deregulated in HF patients.
(A) Relative expression of PGC1α in cardiac biopsies from 12 patients with ischemic HF and five biopsies from the non-infarcted zone from the same individuals (GEO accession number GSE26887) [48]. (B) Relative expression of PGC1α in left ventricle of 16 DCM patients and 10 normal individuals (GEO accession number GSE1145). (C) Model summarizing the functional and pathological relevance of the cardiometabolic miR-29/PGC1α axis. Under physiological conditions, mature miR-29 members regulate PGC1α and control mitochondrial homeostasis. However, the pathologic silencing of miR-29 leads to PGC1α up-regulation, and the increment in the expression of this transcriptional coactivator triggers mitochondrial biogenesis and hyperplasia. Large amounts of small mitochondria in cardiomyocytes may contribute to triggering diastolic dysfunction, systemic hypertension, pulmonary congestion, and vascular remodeling, resulting in heart failure and premature death. Original raw data can be found in S1 Data file. DCM, dilated cardiomyopathy; HF, heart failure.

References

    1. Ponikowski P, Voors AA, Anker SD, Bueno H, Cleland JGF, Coats AJS, et al. 2016 ESC Guidelines for the diagnosis and treatment of acute and chronic heart failure. Rev Esp Cardiol (Engl Ed). 2016;69(12):1167 10.1016/j.rec.2016.11.005 . - DOI - PubMed
    1. Ziaeian B, Fonarow GC. Epidemiology and aetiology of heart failure. Nat Rev Cardiol. 2016;13(6):368–78. 10.1038/nrcardio.2016.25 . - DOI - PMC - PubMed
    1. Zhao Z, Wang H, Jessup JA, Lindsey SH, Chappell MC, Groban L. Role of estrogen in diastolic dysfunction. Am J Physiol Heart Circ Physiol. 2014;306(5):H628–40. 10.1152/ajpheart.00859.2013 . - DOI - PMC - PubMed
    1. Anastasiadou E, Jacob LS, Slack FJ. Non-coding RNA networks in cancer. Nat Rev Cancer. 2018;18(1):5–18. 10.1038/nrc.2017.99 . - DOI - PMC - PubMed
    1. Sallam T, Sandhu J, Tontonoz P. Long noncoding RNA discovery in cardiovascular disease: decoding form to function. Circ Res. 2018;122(1):155–66. 10.1161/CIRCRESAHA.117.311802 . - DOI - PMC - PubMed

Publication types

Substances