

Propensity-score matching with competing risks in survival analysis
- PMID: 30347461
- PMCID: PMC6900780
- DOI: 10.1002/sim.8008
Propensity-score matching with competing risks in survival analysis
Abstract
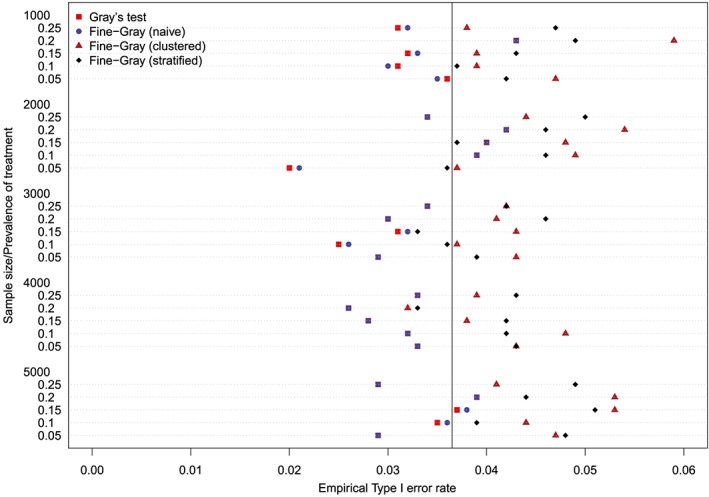
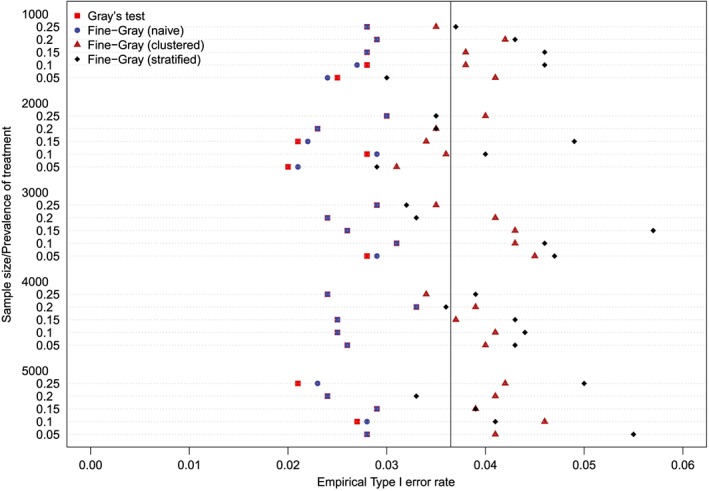
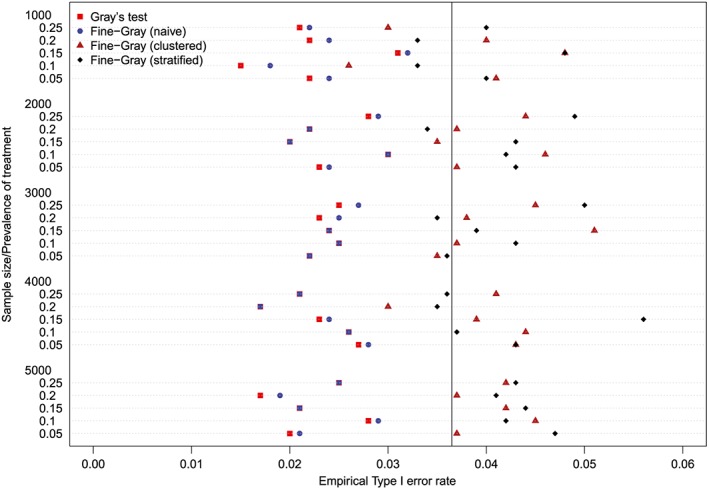
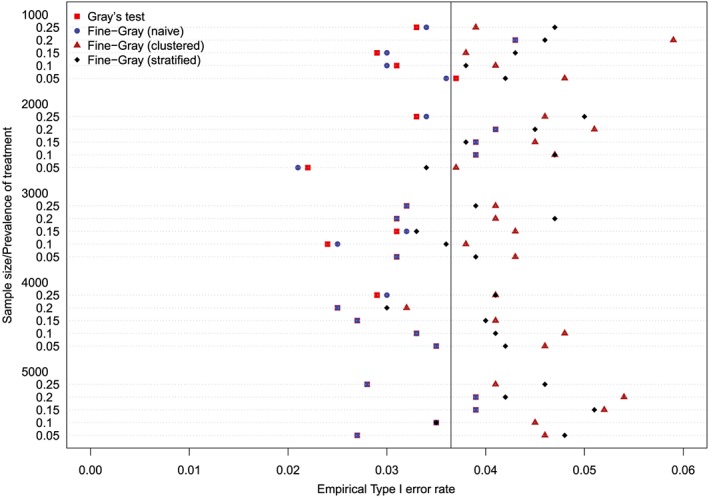
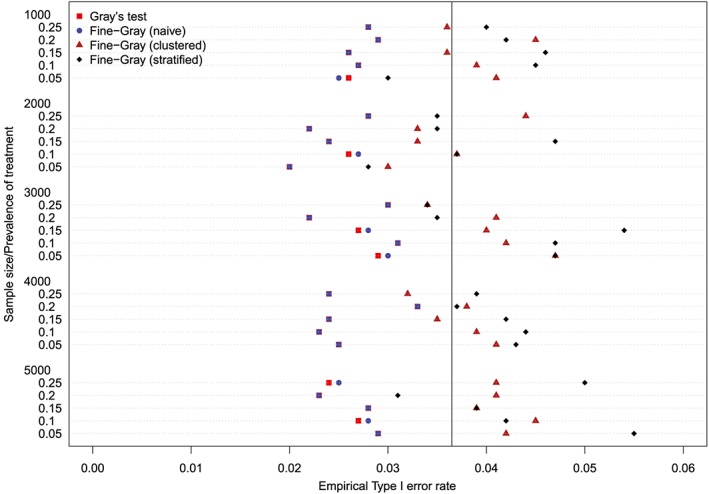
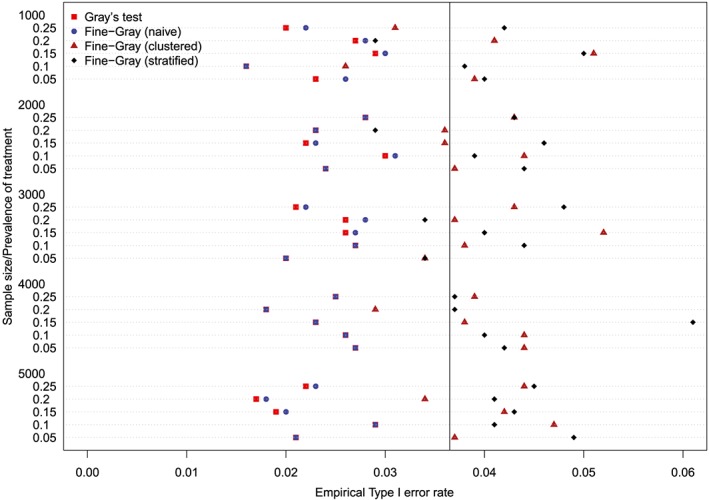
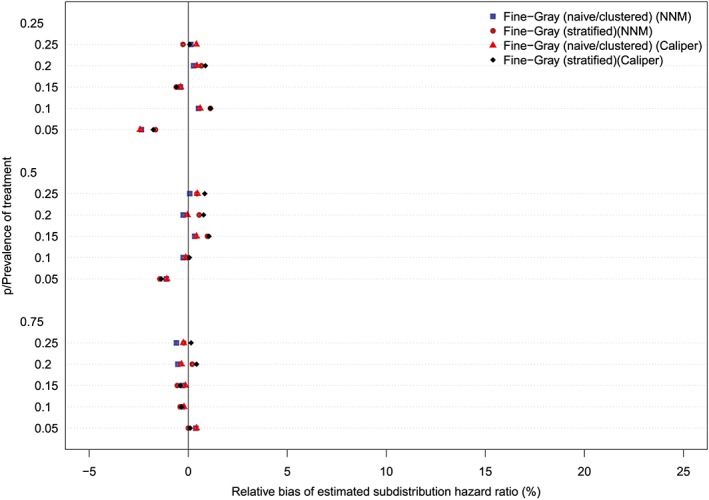
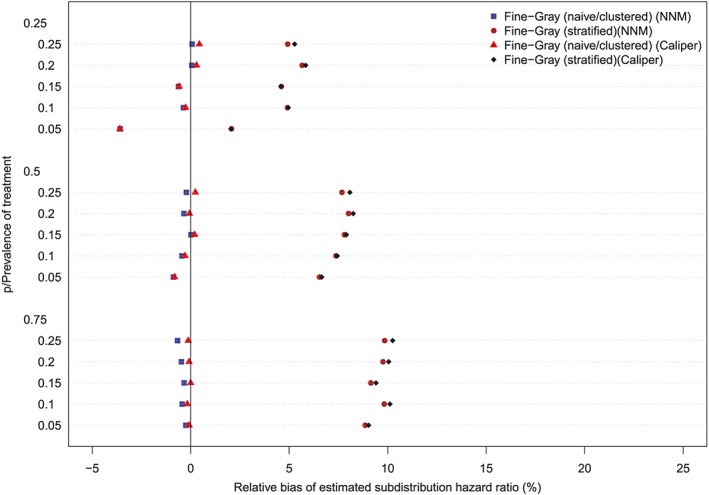
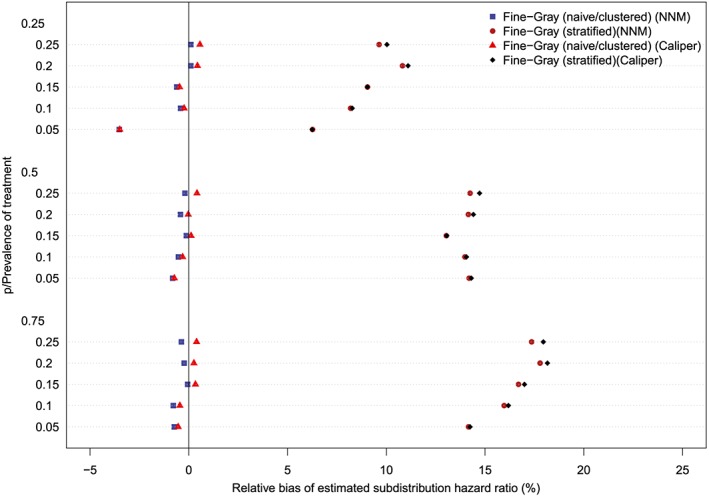
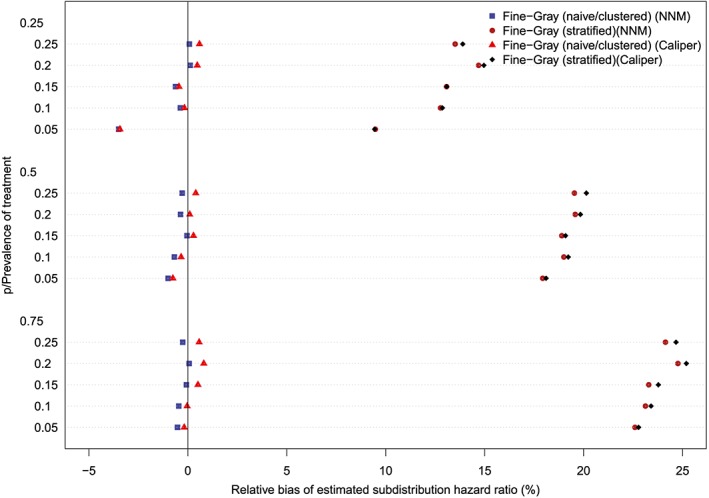
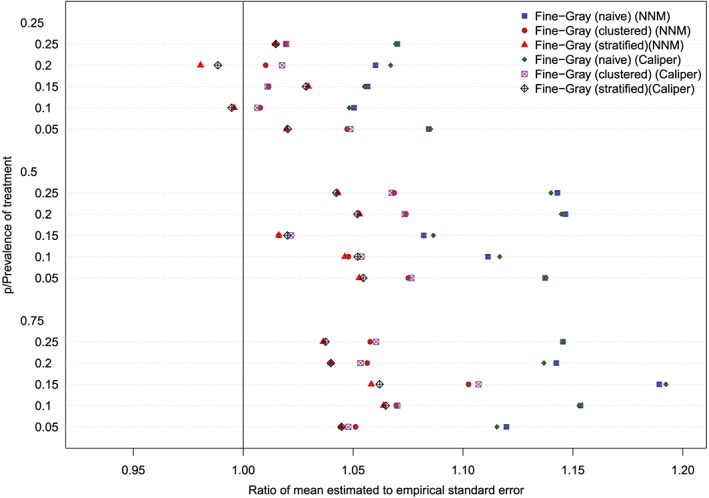
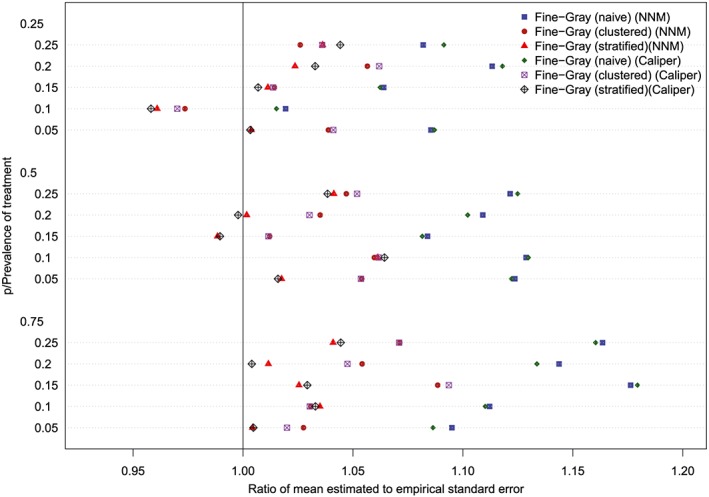
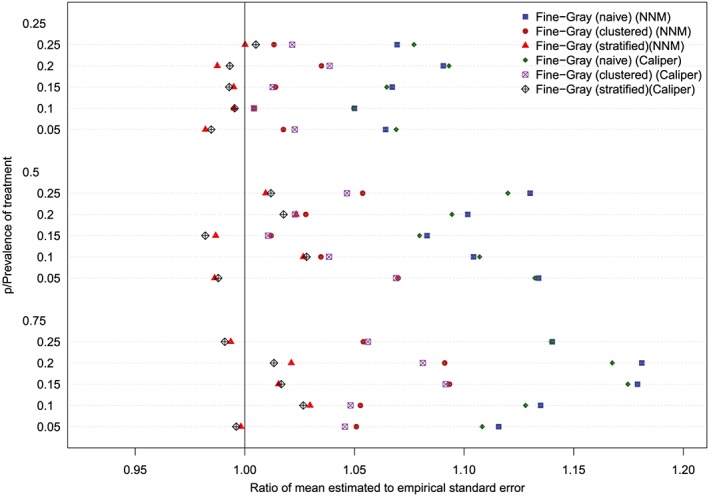
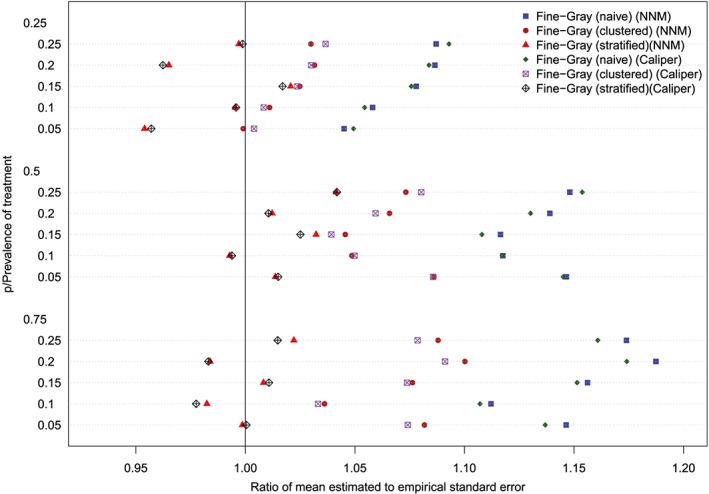
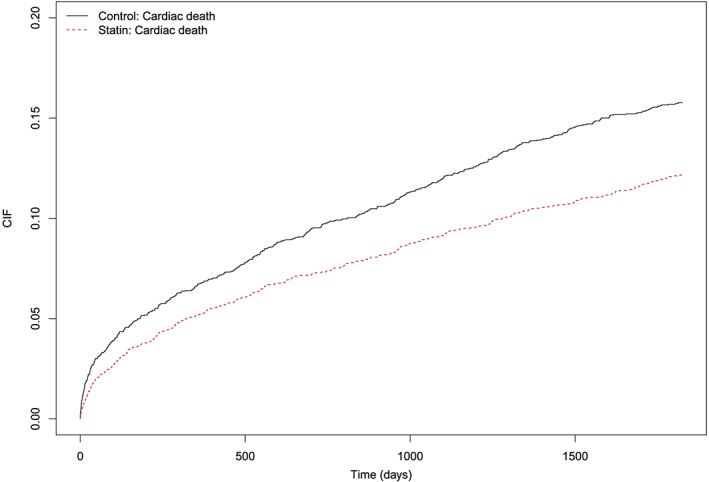
Propensity-score matching is a popular analytic method to remove the effects of confounding due to measured baseline covariates when using observational data to estimate the effects of treatment. Time-to-event outcomes are common in medical research. Competing risks are outcomes whose occurrence precludes the occurrence of the primary time-to-event outcome of interest. All non-fatal outcomes and all cause-specific mortality outcomes are potentially subject to competing risks. There is a paucity of guidance on the conduct of propensity-score matching in the presence of competing risks. We describe how both relative and absolute measures of treatment effect can be obtained when using propensity-score matching with competing risks data. Estimates of the relative effect of treatment can be obtained by using cause-specific hazard models in the matched sample. Estimates of absolute treatment effects can be obtained by comparing cumulative incidence functions (CIFs) between matched treated and matched control subjects. We conducted a series of Monte Carlo simulations to compare the empirical type I error rate of different statistical methods for testing the equality of CIFs estimated in the matched sample. We also examined the performance of different methods to estimate the marginal subdistribution hazard ratio. We recommend that a marginal subdistribution hazard model that accounts for the within-pair clustering of outcomes be used to test the equality of CIFs and to estimate subdistribution hazard ratios. We illustrate the described methods by using data on patients discharged from hospital with acute myocardial infarction to estimate the effect of discharge prescribing of statins on cardiovascular death.
Keywords: Monte Carlo simulations; competing risk; cumulative incidence function; matching; propensity score; propensity score matching; survival analysis.
© 2018 The Authors. Statistics in Medicine Published by John Wiley & Sons Ltd.
Figures
References
-
- Rosenbaum PR, Rubin DB. The central role of the propensity score in observational studies for causal effects. Biometrika. 1983;70(1):41‐55.
-
- Austin PC. Propensity‐score matching in the cardiovascular surgery literature from 2004 to 2006: a systematic review and suggestions for improvement. J Thorac Cardiovasc Surg. 2007;134(5):1128‐1135. - PubMed
-
- Austin PC. A critical appraisal of propensity‐score matching in the medical literature between 1996 and 2003. Statist Med. 2008;27(12):2037‐2049. - PubMed
-
- Austin PC. A report card on propensity‐score matching in the cardiology literature from 2004 to 2006: a systematic review and suggestions for improvement. Circ Cardiovasc Qual Outcomes. 2008;1:62‐67. - PubMed
Publication types
MeSH terms
Substances
Grants and funding
LinkOut - more resources
Full Text Sources