

Disparities in Unintentional Occupational Injury Mortality between High-Income Countries and Low- and Middle-Income Countries: 1990⁻2016
- PMID: 30347672
- PMCID: PMC6210857
- DOI: 10.3390/ijerph15102296
Disparities in Unintentional Occupational Injury Mortality between High-Income Countries and Low- and Middle-Income Countries: 1990⁻2016
Abstract
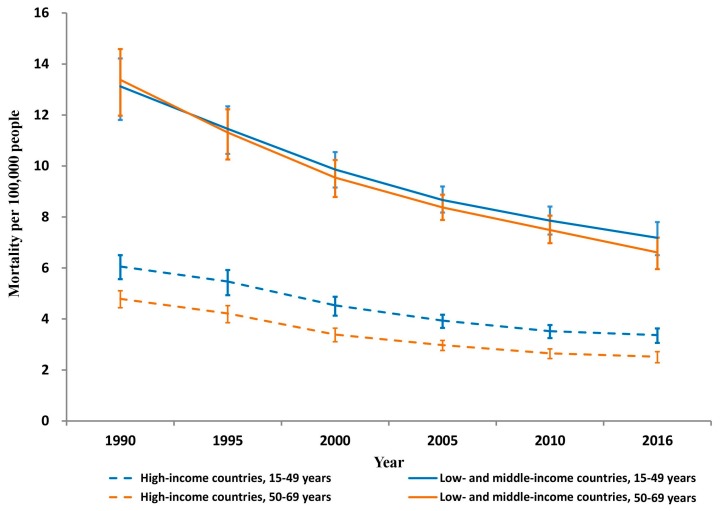
Objective: Using estimates from the Global Burden of Disease (GBD) study, we examined differences in unintentional occupational injury mortality rates from 1990 to 2016 between high-income countries (HICs) and low- and middle-income countries (LMICs).
Methods: Unintentional occupational injury mortality rates were obtained through the GBD online visualization tool. We quantified mortality changes over time for common external causes of injury for ages 15⁻49 years and 50⁻69 years separately in HICs and LMICs using negative binomial regression models.
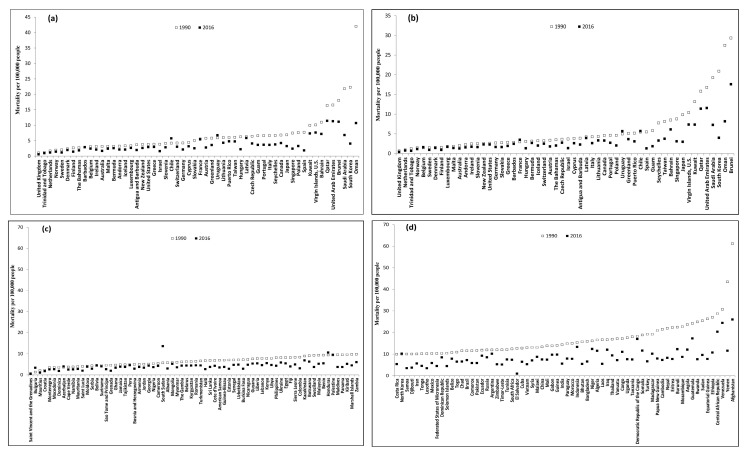
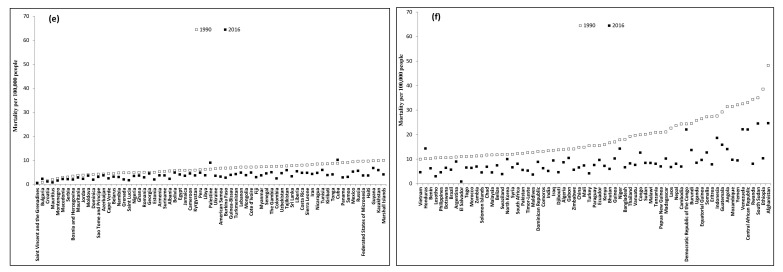
Results: In 2016, there were 24,396 and 303,999 unintentional occupational injury deaths among individuals aged 15 to 69 years in HICs and LMICs, respectively, corresponding to 3.1 and 7.0 per 100,000 people. Between 1990 and 2016, unintentional occupational injury mortality for people aged 15⁻69 years dropped 46% (from 5.7 to 3.1 per 100,000 people) in HICs and 42% in LMICs (from 13.2 to 7.0 per 100,000 people). Sustained and large disparities existed between HICs and LMICs for both sexes and both age groups during 1990⁻2016 (mortality rate ratio: 2.2⁻2.4). All unintentional occupational injury causes of death displayed significant reduction with one exception (ages 15⁻49 years in HICs). Country-specific analysis revealed large variations in unintentional occupational injury mortality and changes in occupational injury mortality between 1990 and 2016.
Conclusions: Despite substantial decreases in mortality between 1990 and 2016 for both HICs and LMICs, a large disparity continues to exist between HICs and LMICs. Multifaceted efforts are needed to reduce the disparity.
Keywords: disparity; occupational injury; unintentional.
Conflict of interest statement
The authors declare no conflict of interest.
Figures

Similar articles
-
Differences in cause-specific patterns of unintentional injury mortality among 15-44-year-olds in income-based country groups.Accid Anal Prev. 2002 Jul;34(4):541-51. doi: 10.1016/s0001-4575(01)00052-5. Accid Anal Prev. 2002. PMID: 12067117
-
Unintentional injuries and violence among adolescents aged 12-15 years in 68 low-income and middle-income countries: a secondary analysis of data from the Global School-Based Student Health Survey.Lancet Child Adolesc Health. 2019 Sep;3(9):616-626. doi: 10.1016/S2352-4642(19)30195-6. Epub 2019 Jul 2. Lancet Child Adolesc Health. 2019. PMID: 31278043
-
Stroke in critically ill patients with respiratory failure due to COVID-19: Disparities between low-middle and high-income countries.Heart Lung. 2024 Nov-Dec;68:131-144. doi: 10.1016/j.hrtlng.2024.06.015. Epub 2024 Jul 4. Heart Lung. 2024. PMID: 38968643
-
Time to Surgery in Spinal Trauma: A Meta-Analysis of the World's Literature Comparing High-Income Countries to Low-Middle Income Countries.World Neurosurg. 2022 Nov;167:e268-e282. doi: 10.1016/j.wneu.2022.07.140. Epub 2022 Aug 7. World Neurosurg. 2022. PMID: 35948226
-
Unintentional injury prevention and the role of occupational therapy in the Solomon Islands: an integrative review.Rural Remote Health. 2016 Oct-Dec;16(4):3810. Epub 2016 Oct 21. Rural Remote Health. 2016. PMID: 27764951 Review.
Cited by
-
Global patterns of hemophilia drug trials, hemophilia care, and health care measures.Res Pract Thromb Haemost. 2025 Feb 27;9(2):102714. doi: 10.1016/j.rpth.2025.102714. eCollection 2025 Feb. Res Pract Thromb Haemost. 2025. PMID: 40224274 Free PMC article.
-
Characteristics of commercial determinants of health research on corporate activities: A scoping review.PLoS One. 2024 Apr 26;19(4):e0300699. doi: 10.1371/journal.pone.0300699. eCollection 2024. PLoS One. 2024. PMID: 38669229 Free PMC article.
-
The prevalence of occupational injuries and associated risk factors among workers in iron and steel industries: a systematic review and meta-analysis.BMC Public Health. 2024 Sep 27;24(1):2602. doi: 10.1186/s12889-024-20111-w. BMC Public Health. 2024. PMID: 39333969 Free PMC article.
-
The Relationship between Free Press and Under-Reporting of Non-Fatal Occupational Injuries with Data from Representative National Indicators, 2015: Focusing on the Lethality Rate of Occupational Injuries among 39 Countries.Int J Environ Res Public Health. 2018 Dec 14;15(12):2856. doi: 10.3390/ijerph15122856. Int J Environ Res Public Health. 2018. PMID: 30558139 Free PMC article.
-
Sex differences in adolescents' occupational aspirations: Variations across time and place.PLoS One. 2022 Jan 26;17(1):e0261438. doi: 10.1371/journal.pone.0261438. eCollection 2022. PLoS One. 2022. PMID: 35081124 Free PMC article.
References
-
- United Nations Transforming Our World: The 2030 Agenda for Sustainable Development. [(accessed on 16 October 2018)]; Available online: https://sustainabledevelopment.un.org/post2015/transformingourworld.
-
- International Labour Office (ILO) Independent Evaluation of the Ilo’s Strategy on Occupational Safety and Health: Workers and Enterprises Benefit from Improved Safety and Health Conditions at Work. International Labour Office; Geneva, Switzerland: 2013.
-
- Bureau of Labor Statistics (BLS) Census of Fatal Occupational Injuries Charts, 1992–2016. Washington, DC: USDOL Bureau of Labor Statistics (Bls) [(accessed on 1 March 2018)]; Available online: https://www.bls.gov/iif/oshwc/cfoi/cfch0015.pdf.
-
- Ministry of Employment and Labor Major Statistics. [(accessed on 1 March 2018)]; Available online: http://www.moel.go.kr/english/pas/pasMajor.jsp.
MeSH terms
LinkOut - more resources
Full Text Sources
Medical
