

Lipid Identification and Transcriptional Analysis of Controlling Enzymes in Bovine Ovarian Follicle
- PMID: 30347829
- PMCID: PMC6214003
- DOI: 10.3390/ijms19103261
Lipid Identification and Transcriptional Analysis of Controlling Enzymes in Bovine Ovarian Follicle
Abstract
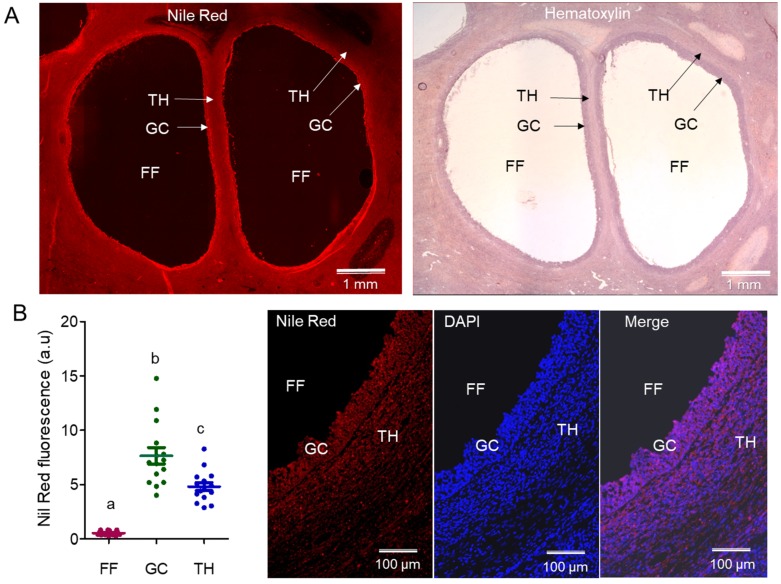
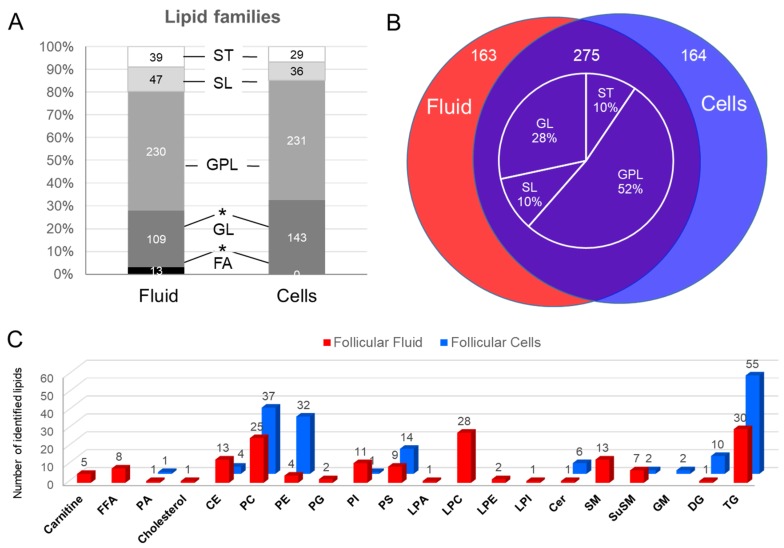
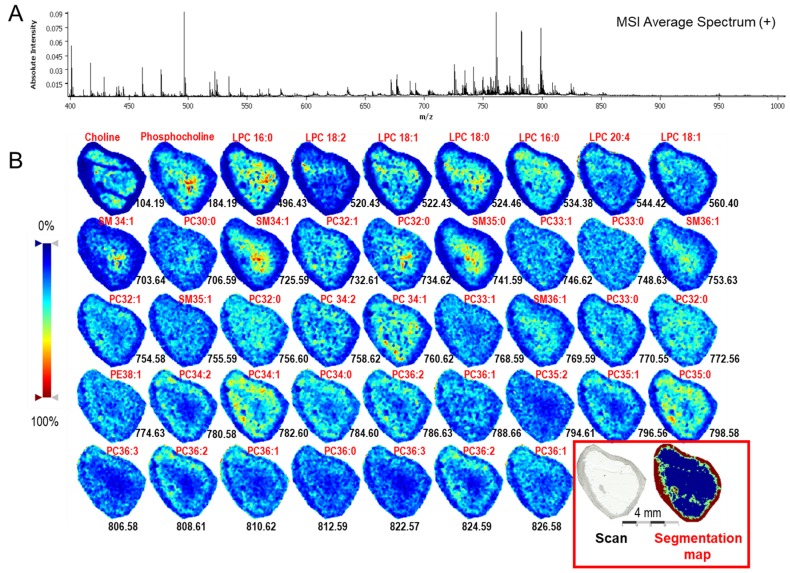
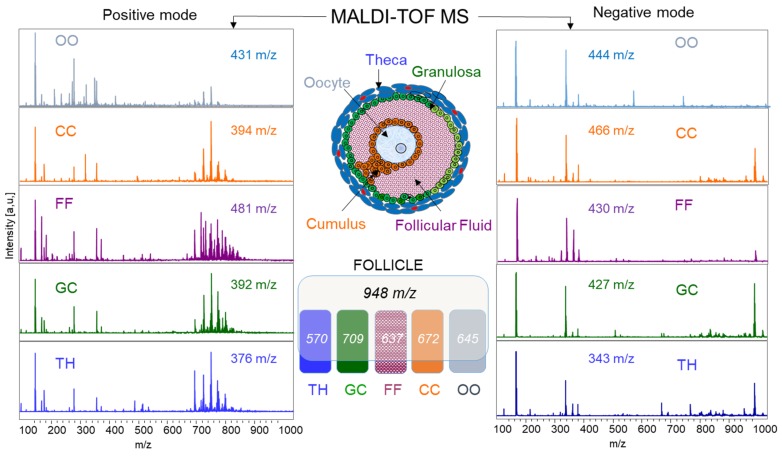
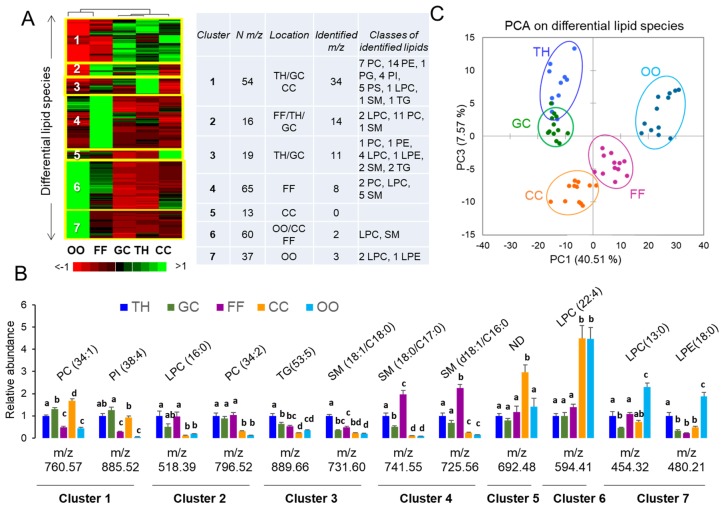
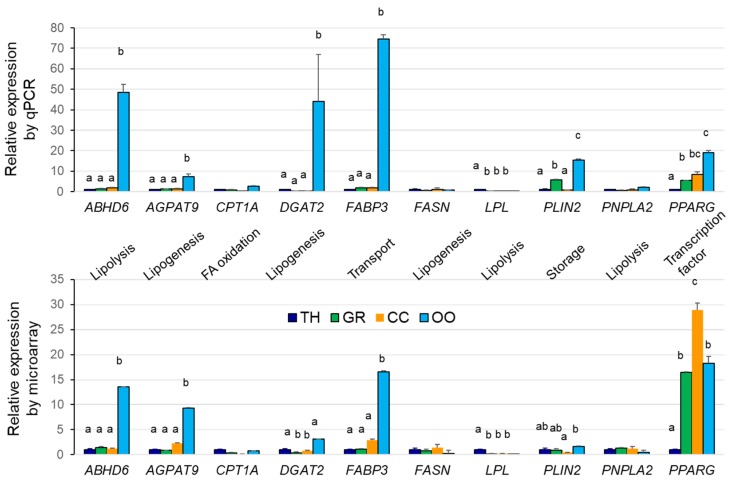
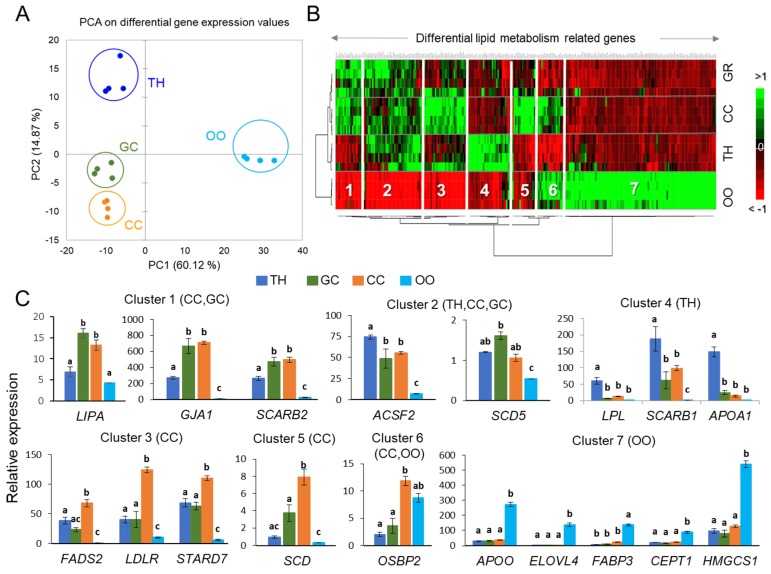
Ovarian follicle provides a favorable environment for enclosed oocytes, which acquire their competence in supporting embryo development in tight communications with somatic follicular cells and follicular fluid (FF). Although steroidogenesis in theca (TH) and granulosa cells (GC) is largely studied, and the molecular mechanisms of fatty acid (FA) metabolism in cumulus cells (CC) and oocytes are emerging, little data is available regarding lipid metabolism regulation within ovarian follicles. In this study, we investigated lipid composition and the transcriptional regulation of FA metabolism in 3⁻8 mm ovarian follicles in bovine. Using liquid chromatography and mass spectrometry (MS), 438 and 439 lipids were identified in FF and follicular cells, respectively. From the MALDI-TOF MS lipid fingerprints of FF, TH, GC, CC, and oocytes, and the MS imaging of ovarian sections, we identified 197 peaks and determined more abundant lipids in each compartment. Transcriptomics revealed lipid metabolism-related genes, which were expressed constitutively or more specifically in TH, GC, CC, or oocytes. Coupled with differential lipid composition, these data suggest that the ovarian follicle contains the metabolic machinery that is potentially capable of metabolizing FA from nutrient uptake, degrading and producing lipoproteins, performing de novo lipogenesis, and accumulating lipid reserves, thus assuring oocyte energy supply, membrane synthesis, and lipid-mediated signaling to maintain follicular homeostasis.
Keywords: MALDI MS profiling; bovine; follicular fluid; gene expression; granulosa; lipids; mass spectrometry imaging; oocyte; ovarian follicle; theca.
Conflict of interest statement
The authors declare no conflict of interest. The founding sponsors had no role in the design of the study; in the collection, analyses, or interpretation of data; in the writing of the manuscript, and in the decision to publish the results.
Figures
Similar articles
-
MALDI-TOF Mass Spectrometry Revealed Significant Lipid Variations in Follicular Fluid and Somatic Follicular Cells but Not in Enclosed Oocytes between the Large Dominant and Small Subordinate Follicles in Bovine Ovary.Int J Mol Sci. 2020 Sep 11;21(18):6661. doi: 10.3390/ijms21186661. Int J Mol Sci. 2020. PMID: 32932995 Free PMC article.
-
Interactions of bovine oocytes with follicular elements with respect to lipid metabolism.Anim Sci J. 2017 Oct;88(10):1491-1497. doi: 10.1111/asj.12799. Epub 2017 Apr 12. Anim Sci J. 2017. PMID: 28402007
-
Prepubertal heifers versus cows-The differences in the follicular environment.Theriogenology. 2017 Jan 1;87:36-47. doi: 10.1016/j.theriogenology.2016.08.007. Epub 2016 Aug 12. Theriogenology. 2017. PMID: 27634396
-
Metabolic exchanges between the oocyte and its environment: focus on lipids.Reprod Fertil Dev. 2021 Dec;34(2):1-26. doi: 10.1071/RD21249. Reprod Fertil Dev. 2021. PMID: 35231385 Review.
-
Oocyte-somatic cell interactions in the human ovary-novel role of bone morphogenetic proteins and growth differentiation factors.Hum Reprod Update. 2016 Dec;23(1):1-18. doi: 10.1093/humupd/dmw039. Epub 2016 Oct 26. Hum Reprod Update. 2016. PMID: 27797914 Free PMC article. Review.
Cited by
-
Protein Cargo of Extracellular Vesicles From Bovine Follicular Fluid and Analysis of Their Origin From Different Ovarian Cells.Front Vet Sci. 2020 Nov 4;7:584948. doi: 10.3389/fvets.2020.584948. eCollection 2020. Front Vet Sci. 2020. PMID: 33330709 Free PMC article.
-
Oviduct Fluid Extracellular Vesicles Change the Phospholipid Composition of Bovine Embryos Developed In Vitro.Int J Mol Sci. 2020 Jul 27;21(15):5326. doi: 10.3390/ijms21155326. Int J Mol Sci. 2020. PMID: 32727074 Free PMC article.
-
Energy metabolism of follicular environment during oocyte growth and maturation.J Reprod Dev. 2020 Feb 14;66(1):1-7. doi: 10.1262/jrd.2019-102. Epub 2019 Dec 2. J Reprod Dev. 2020. PMID: 31787727 Free PMC article. Review.
-
Metabolism of fatty acids in follicular cells, oocytes, and blastocysts.Reprod Fertil. 2022 Apr 29;3(2):R96-R108. doi: 10.1530/RAF-21-0123. eCollection 2022 Apr 1. Reprod Fertil. 2022. PMID: 35706579 Free PMC article. Review.
-
Response of Bovine Cumulus-Oocytes Complexes to Energy Pathway Inhibition during In Vitro Maturation.Genes (Basel). 2021 May 29;12(6):838. doi: 10.3390/genes12060838. Genes (Basel). 2021. PMID: 34072406 Free PMC article.
References
-
- Leroy J.L., Opsomer G., Van Soom A., Goovaerts I.G., Bols P.E. Reduced fertility in high-yielding dairy cows: Are the oocyte and embryo in danger? Part I. The importance of negative energy balance and altered corpus luteum function to the reduction of oocyte and embryo quality in high-yielding dairy cows. Reprod. Domest. Anim. 2008;43:612–622. doi: 10.1111/j.1439-0531.2007.00960.x. - DOI - PubMed
MeSH terms
LinkOut - more resources
Full Text Sources
Molecular Biology Databases
Miscellaneous
