. 2018 Jan 1:17:1533033818803632.
doi: 10.1177/1533033818803632.

Image-Based Profiling of Patient-Derived Pancreatic Tumor-Stromal Cell Interactions Within a Micropatterned Tumor Model

Affiliations

Image-Based Profiling of Patient-Derived Pancreatic Tumor-Stromal Cell Interactions Within a Micropatterned Tumor Model

Shilpaa Mukundan et al. Technol Cancer Res Treat. .

Abstract

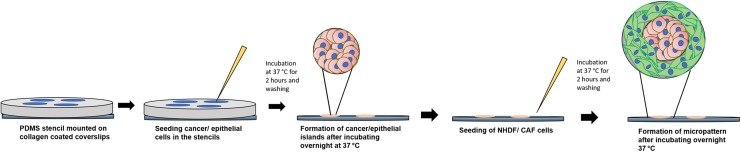
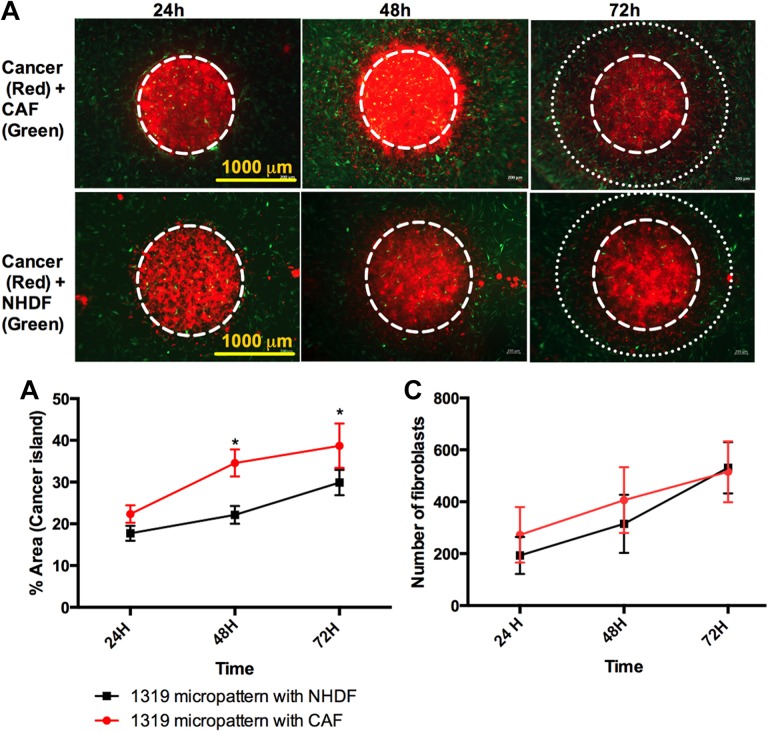
Pancreatic cancer is one of the most aggressive cancers with a 5-year patient survival rate of 8.2% and limited availability of therapeutic agents to target metastatic disease. Pancreatic cancer is characterized by a dense stromal cell population with unknown contribution to the progression or suppression of tumor growth. In this study, we describe a microengineered tumor stromal assay of patient-derived pancreatic cancer cells to study the heterotypic interactions of patient pancreatic cancer cells with different types of stromal fibroblasts under basal and drug-treated conditions. The population dynamics of tumor cells in terms of migration and viability were visualized as a functional end point. Coculture with cancer-associated fibroblasts increased the migration of cancer cells when compared to dermal fibroblasts. Finally, we imaged the response of a bromodomain and extraterminal inhibitor on the viability of pancreatic cancer clusters surrounding by stroma in microengineered tumor stromal assay. We visualized a codynamic reduction in both cancer and stromal cells with bromodomain and extraterminal treatment compared to the dimethyl sulfoxide-treated group. This study demonstrates the ability to engineer tumor-stromal assays with patient-derived cells, study the role of diverse types of stromal cells on cancer progression, and precisely visualize a coculture during the screening of therapeutic compounds.

Keywords: BET; microengineered tumor stromal assay (µTSA); pancreatic cancer; stroma; tumor microenvironment.


Conflict of interest statement

Declaration of Conflicting Interests: The author(s) declared no potential conflicts of interest with respect to the research, authorship, and/or publication of this article.

Figures

Figure 1.
Figure 1.
Generation of tumor–stromal micropatterns. Schematic representation of generating the micropatterns using PDMS stencils and epithelial/cancer cells (islands) surrounded by NHDF/CAF (stromal cells). CAF indicates cancer-associated fibroblast; NHDF, normal human dermal fibroblast; PDMS, polydimethylsiloxane.
Figure 2.
Figure 2.
Migration of normal patient-derived epithelial cells versus cancer cells. Pancreatic epithelial cells (HPDE6/E6E7) expressing mCherry and pancreatic cancer cells (1319-3-NE) were seeded on PDMS stencils to form respective epithelial/cancer islands. A, Fluorescent images of the micropatterns taken at different time points ranging from 3 to 48 hours. B, ImageJ analysis of percent area occupied by cancer/epithelial cells at each time point in terms of data (SD; n = 5-6 cancer/epithelial islands). * denotes statistical significance when compared to the control epithelial island (P < .05). PDMS indicates polydimethylsiloxane; SD, standard deviation.
Figure 3.
Figure 3.
Pancreatic cancer cells (1319-MP3-NE mCherry) were seeded in PDMS stencils of varying circle diameters (P1-P4) and cocultured with normal dermal fibroblast (NHDF-GFP). P1, P2, P3, and P4 were 3, 1.5, 0.75, and 0.375 mm, respectively; center-to-center distances were 4, 2, and 1 mm for P2, P3, and P4, respectively. A, Representative fluorescent images of the micropatterns taken at different time points from day 1 to day 4. B, Quantification of the total tumor–stromal interfacial area in each stencil type. C, Migration of cells from the cancer islands using stencils with different tumor–stromal interfacial areas calculated using ImageJ analysis of the images taken at different time points. The increased interfacial area in P4 correlates with the increase in migration of cells. The figure represents data (SD; n = 3-4 micropatterns/condition). * denotes statistical significance when compared to the P1 micropattern (P < .05). PDMS indicates polydimethylsiloxane; SD, standard deviation.
Figure 4.
Figure 4.
Stromal type instigates cancer migration. Pancreatic cancer cells (1319-MP3-NE mCherry) were seeded in PDMS stencils and cocultured with normal dermal fibroblast (NHDF-GFP) or patient-derived pancreatic cancer associated fibroblast (CAF-GFP). A, Fluorescent images of the micropatterns taken at different time points ranging from 24 to 72 hours. The presence of CAFs increase the migration of cancer cells. B, C, ImageJ analysis on the images in terms of data (SD; n = 5-6 cancer islands). * denotes statistical significance when compared to the NHDF group (P < .05). PDMS indicates polydimethylsiloxane; SD, standard deviation.
Figure 5.
Figure 5.
Pharmacological inhibition of growth using BET inhibitor. μTSA of patient-derived pancreatic cancer and CAF cells treated with 1.4 μM BET inhibitor or DMSO controls. A, Representative images of the micropatterns taken before and after BET inhibitor/DMSO at different time points. B, ImageJ analysis of the percent area occupied by the cancer cells over time following DMSO/drug treatment. Treatment with BET inhibitor decreased the viability of cancer cells by approximately 60% marked by the shrinking of cancer islands. C, ImageJ analysis of percent area occupied by the cancer associated fibroblast in the whole micropattern. The ImageJ quantification represented here are based on average (SD; n = 5-6 cancer islands/condition) and *, **, and *** represent statistical significance when compared to the control DMSO-treated group at the respective time points. BET indicates bromodomain and extraterminal; CAF, cancer-associated fibroblast; DMSO, dimethyl sulfoxide; SD, standard deviation; μTSA, microengineered tumor stromal assay.

Similar articles

References

    1. Kaur S, Baine MJ, Jain M, Sasson AR, Batra SK. Early diagnosis of pancreatic cancer: challenges and new developments. Biomark Med. 2012;6(5):597–612. - PMC - PubMed
    1. Bissell MJ, Hines WC. Why don’t we get more cancer? A proposed role of the microenvironment in restraining cancer progression. Nat Med. 2011;17(3):320–329. - PMC - PubMed
    1. Hanahan D, Weinberg Robert A. Hallmarks of cancer: the next generation. Cell. 2011;144(5):646–674. - PubMed
    1. Öhlund D, Elyada E, Tuveson D. Fibroblast heterogeneity in the cancer wound. J Exp Med. 2014;211(8):1503–1523. - PMC - PubMed
    1. Bussard KM, Mutkus L, Stumpf K, Gomez-Manzano C, Marini FC. Tumor-associated stromal cells as key contributors to the tumor microenvironment. Breast Cancer Res. 2016;18(1):84. - PMC - PubMed

Publication types