. 2018 Dec 3;217(12):4092-4105.
doi: 10.1083/jcb.201801122. Epub 2018 Oct 22.

EHD2 is a mechanotransducer connecting caveolae dynamics with gene transcription

Affiliations

EHD2 is a mechanotransducer connecting caveolae dynamics with gene transcription

Stéphanie Torrino et al. J Cell Biol. .

Abstract

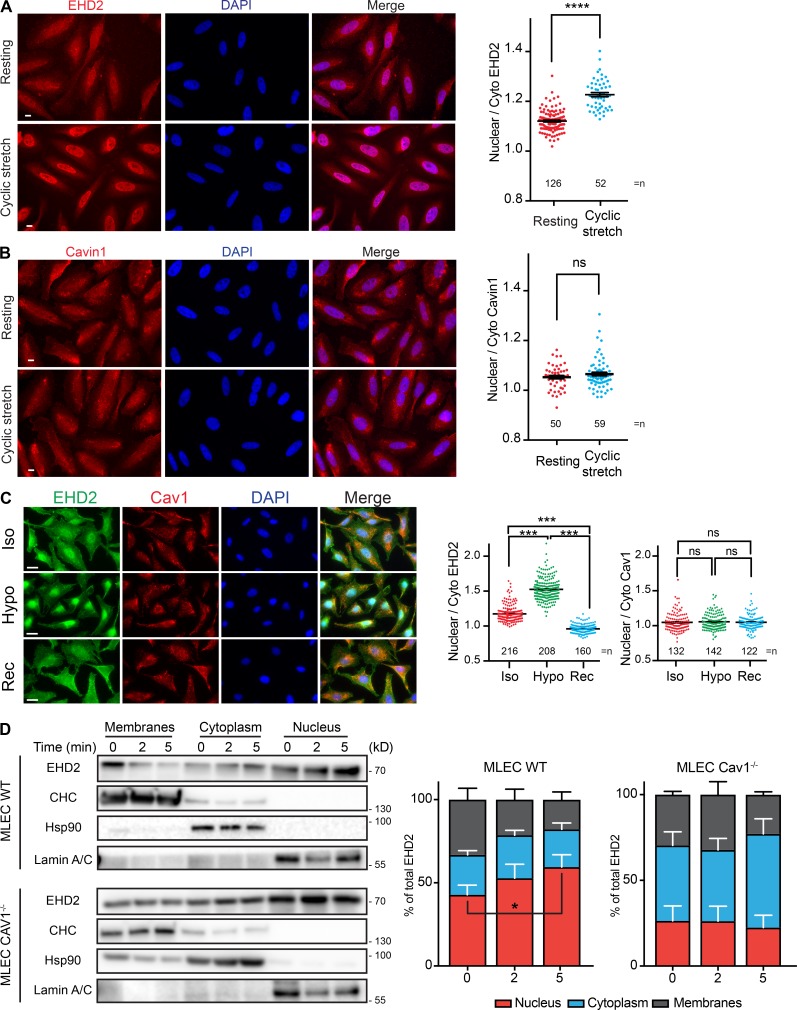
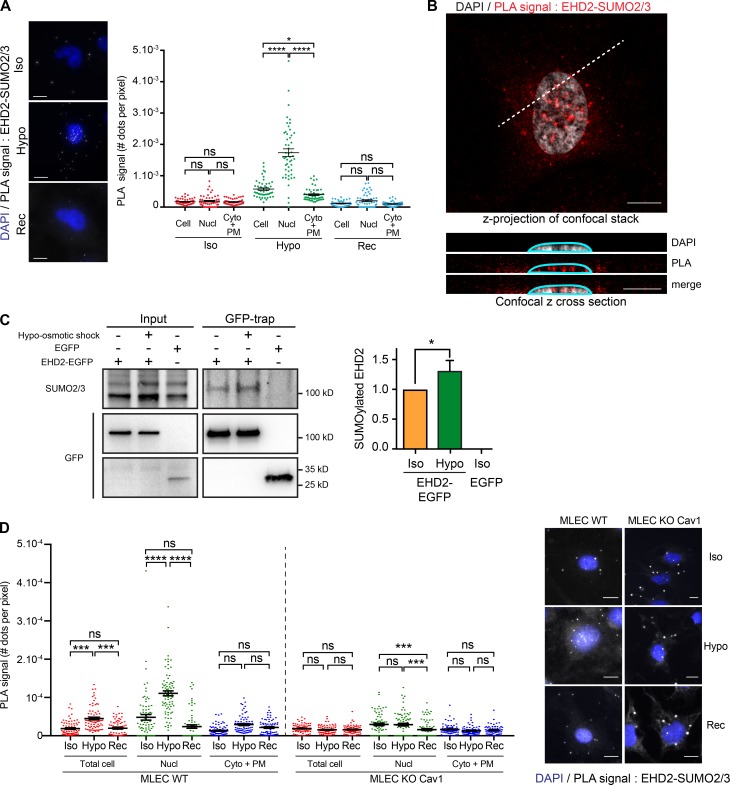
Caveolae are small invaginated pits that function as dynamic mechanosensors to buffer tension variations at the plasma membrane. Here we show that under mechanical stress, the EHD2 ATPase is rapidly released from caveolae, SUMOylated, and translocated to the nucleus, where it regulates the transcription of several genes including those coding for caveolae constituents. We also found that EHD2 is required to maintain the caveolae reservoir at the plasma membrane during the variations of membrane tension induced by mechanical stress. Metal-replica electron microscopy of breast cancer cells lacking EHD2 revealed a complete absence of caveolae and a lack of gene regulation under mechanical stress. Expressing EHD2 was sufficient to restore both functions in these cells. Our findings therefore define EHD2 as a central player in mechanotransduction connecting the disassembly of the caveolae reservoir with the regulation of gene transcription under mechanical stress.


Figures

Figure 1.
Figure 1.
Mechanical stress induces EHD2 nuclear translocation. (A and B) Representative wide-field immunofluorescence (left) and quantification (right) of the nuclear translocation of endogenous EHD2 (A) but not cavin1 (B) in HeLa cells after 30 min of cyclic stretch. (C) Representative wide-field immunofluorescence (left) and quantification (right) of endogenous EHD2 and Cav1 localization in HeLa cells under resting (Iso), after 5 min of 30 mOsm hypo-osmotic shock (Hypo), and 5 min after return to iso-osmotic conditions (Rec). (D) Immunoblot analysis (left) and quantification (right) of equal amounts of nuclear, cytoplasmic and cell membrane extracts after hypo-osmotic shock for the indicated times in MLEC cells having caveolae (WT) or not (Cav1−/−). Scale bar = 10 µm; n ≥ 3 independent experiments; *, P < 0.05; ***, P < 0.001; ****, P < 0.0001; in A and B, two-tailed t test; data are representative of three experiments, mean ± SEM; in C, Bonferroni’s multiple comparison test; data are mean ± SEM; numbers of cells are indicated on the graphs; in D, Dunn’s multiple comparison test; n = 3; data are mean ± SEM.
Figure 2.
Figure 2.
EHD2 is SUMOylated by SUMO2/3 upon mechanical stress. (A) Representative wide-field fluorescence (left) and quantification (right) of in situ PLA experiments in Hs578T cells monitoring EHD2 and SUMO2/3 interaction in the whole cell (Cell), the nucleus (Nucl), and the cell minus the nucleus (Cyto + plasma membrane) under resting (Iso, n = 51), under hypo-osmotic (Hypo, n = 51), and after return to iso-osmotic (Rec, n = 50) conditions. (B) Representative z-projection (average intensity) of a confocal stack of a PLA experiment monitoring EHD2 and SUMO2/3 interaction (red signal) in MLEC cells 5 min after 30 mOsm hypo-osmotic shock. A confocal z cross section along the dashed line shows localization of PLA spots in the nucleus (DAPI; gray). (C) Immunoblot analysis (left) and quantification (right; SUMO2/3 level normalized to GFP) of EGFP-EHD2 SUMOylation by SUMO2/3 in immunoprecipitates from stable HeLa His-SUMO2/3 cells transfected with EHD2-EGFP or EGFP under Iso and Hypo conditions. (D) Same PLA experiments as in A performed in MLEC WT (Iso, n = 76; Hypo, n = 77; Rec, n = 72) or Cav1−/− cells (Iso, n = 75; Hypo, n = 75; Rec, n = 75). Scale bar = 10 µm; *, P < 0.05; ***, P < 0.001; ****, P < 0.0001; in A and D, Dunnett’s multiple comparison test, data are representative of three experiments, mean ± SEM; in C, repeated measures one-way ANOVA; data are mean ± SEM.
Figure 3.
Figure 3.
EHD2 is required for the stabilization of caveolae and the control of gene transcription during tension variations at the plasma membrane. (A) GSEA was performed to identify gene sets positively (+) or negatively (–) enriched by cyclic stretch in Hs578T cells depleted or not from EHD2. (B) Quantification of Cav1, Cav2, cavin1, cavin2, and flotillin-1 (Flot1) mRNA levels in HeLa cells transfected with control siRNA (CTRL) or siEHD2, after 30 min cyclic stretch. (C) Quantification of Cav1, Cav2, cavin1, and cavin2 mRNA levels in HeLa cells transfected with control siRNA (CTRL), siMOKA, or siKLF7 after 30 min cyclic stretch. (D) Representative TIRF images (left) and quantification (right) of changes in cell-surface Cav1 spot numbers in control siRNA (CTRL) or siEHD2-transfected Cav1-EGFP HeLa cells under resting (Iso), under hypo-osmotic (Hypo), and after return to iso-osmotic (Rec) conditions. Cells are delineated by dashes. (E) Quantification of changes in cell-surface endogenous Cav1 spot numbers in HeLa cells depleted (siEHD2) or not (CTRL) for EHD2 and transfected or not with EHD2-EGFP (+ EHD2) under Iso, Hypo, and Rec conditions. (F) Relative changes of the mean tether force under Hypo and Rec conditions in control siRNA (CTRL) and siEHD2 HeLa cells. (G) Quantification of cell surface Cav1 spot numbers at rest and after 30 min cyclic stretch in control siRNA (CTRL) or siEHD2 transfected HeLa cells. *, P < 0.05; **, P < 0.001; ***, P < 0.001; ****, P < 0.0001; two tailed t test. In B and C, Bonferroni’s multiple comparison test; n = 3 independent experiments; in D–G, two-way ANOVA and Tukey’s multiple comparisons test; n = 3; data are mean ± SEM. Numbers of cells are indicated on histogram bars. Scale bar = 10 µm.
Figure 4.
Figure 4.
Loss of EHD2 expression impairs caveolae mechanosensing and gene transcription in breast cancer cells. (A) Immunoblot (left) and quantification (right) of EHD2, Cav1, and cavin1 protein levels normalized to CHC in Hs578T and MDA-MB-436 cells. (B and C) Representative TIRF images of changes in cell surface Cav1 spot numbers (left) and quantification (right) under resting (Iso) and hypo-osmotic (Hypo) conditions in Hs578T (B) or MDA-MB-436 (C) cells. Cells are delineated by dashes. Scale bar = 10 µm. (D) Quantification of changes in cell surface Cav1 spot numbers in MDA-MB-436 cells transfected or not (CTRL) with EHD2-EGFP under Iso and Hypo conditions. (E) Quantification of Cav1, Cav2, cavin1, and cavin2 mRNA levels in MDA-MB-436 cells transfected or not (CTRL) with EHD2 or Cav1 and in MDA-MB-436 cells depleted for Cav1 (siCav1) and transfected or not by EHD2 under hypo-osmotic conditions. (F) Quantification of Cav1, Cav2, cavin1, and cavin2 mRNA levels in Hs578T cells transfected with control siRNA (CTRL), siEHD2, or siCav1 after 30 min of cyclic stretch. For all panels, n ≥ 3 independent experiments; mRNA levels are compared with resting conditions (dotted line); *, P < 0.05; **, P < 0.01; ***, P < 0.001; two tailed t test; data are mean ± SEM; numbers of cells are indicated on histogram bars.
Figure 5.
Figure 5.
EHD2 expression is required for the presence of caveolae at the plasma membrane of breast cancer cells. (A–I) Survey view of the cytoplasmic surface of the plasma membrane in unroofed Hs578T cells (A–C), MDA-MB-436 (D–F) cells, and MDA-MB-436 cells transfected by EHD2-EGFP (G–I). For second inset (C, F, H, and I) use view glasses for 3D viewing of anaglyphs (left eye = red). Arrows indicate caveolae. Arrowheads indicate clathrin-coated pits. (J) Representative immunogold labeling of EM images of Cav1 protein localization in Hs578T and MDA-MB-436 cells. Scale bar = 200 nm. (K) Upon mechanical stress, Cav1, cavin1, and EHD2 are released from flattened caveolae. EHD2, but not cavin1 or Cav1, is SUMOylated and translocated to the nucleus where it controls gene transcription through interaction with MOKA and KLF-7. Upon stress release, EHD2 exits from the nucleus and is required for the stabilization of the caveolae reservoir at the plasma membrane.

References

    1. Ariotti N., Fernández-Rojo M.A., Zhou Y., Hill M.M., Rodkey T.L., Inder K.L., Tanner L.B., Wenk M.R., Hancock J.F., and Parton R.G.. 2014. Caveolae regulate the nanoscale organization of the plasma membrane to remotely control Ras signaling. J. Cell Biol. 204:777–792. 10.1083/jcb.201307055 - DOI - PMC - PubMed
    1. Bolte S., and Cordelières F.P.. 2006. A guided tour into subcellular colocalization analysis in light microscopy. J. Microsc. 224:213–232. 10.1111/j.1365-2818.2006.01706.x - DOI - PubMed
    1. Chan T.F., and Vese L.A.. 2001. Active contours without edges. IEEE Trans. Image Process. 10:266–277. 10.1109/83.902291 - DOI - PubMed
    1. Chen B.C., Legant W.R., Wang K., Shao L., Milkie D.E., Davidson M.W., Janetopoulos C., Wu X.S., Hammer J.A. III, Liu Z., et al. . 2014. Lattice light-sheet microscopy: imaging molecules to embryos at high spatiotemporal resolution. Science. 346:1257998 10.1126/science.1257998 - DOI - PMC - PubMed
    1. Cheng J.P., Mendoza-Topaz C., Howard G., Chadwick J., Shvets E., Cowburn A.S., Dunmore B.J., Crosby A., Morrell N.W., and Nichols B.J.. 2015. Caveolae protect endothelial cells from membrane rupture during increased cardiac output. J. Cell Biol. 211:53–61. 10.1083/jcb.201504042 - DOI - PMC - PubMed

Publication types