. 2018 Nov 6;115(45):E10672-E10681.
doi: 10.1073/pnas.1810580115. Epub 2018 Oct 22.

Identification and validation of a tumor-infiltrating Treg transcriptional signature conserved across species and tumor types

Affiliations

Identification and validation of a tumor-infiltrating Treg transcriptional signature conserved across species and tumor types

Angela M Magnuson et al. Proc Natl Acad Sci U S A. .

Abstract

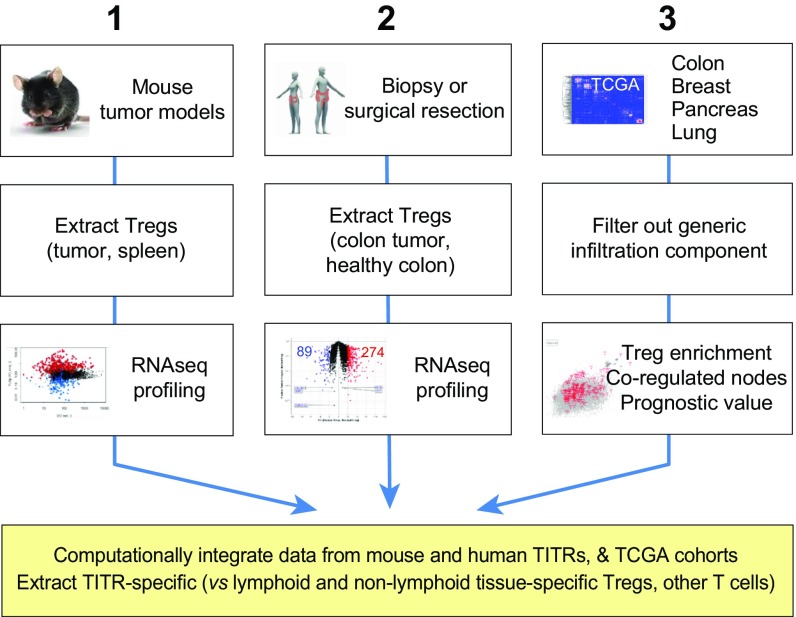
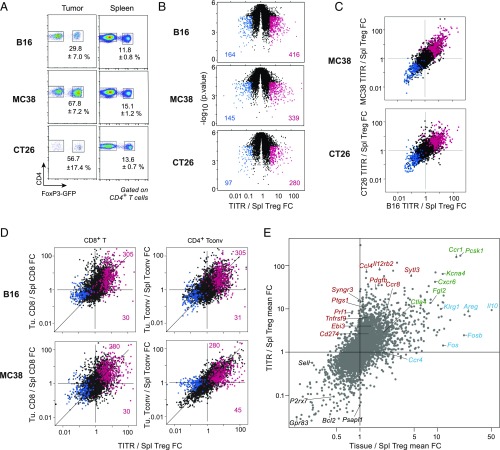
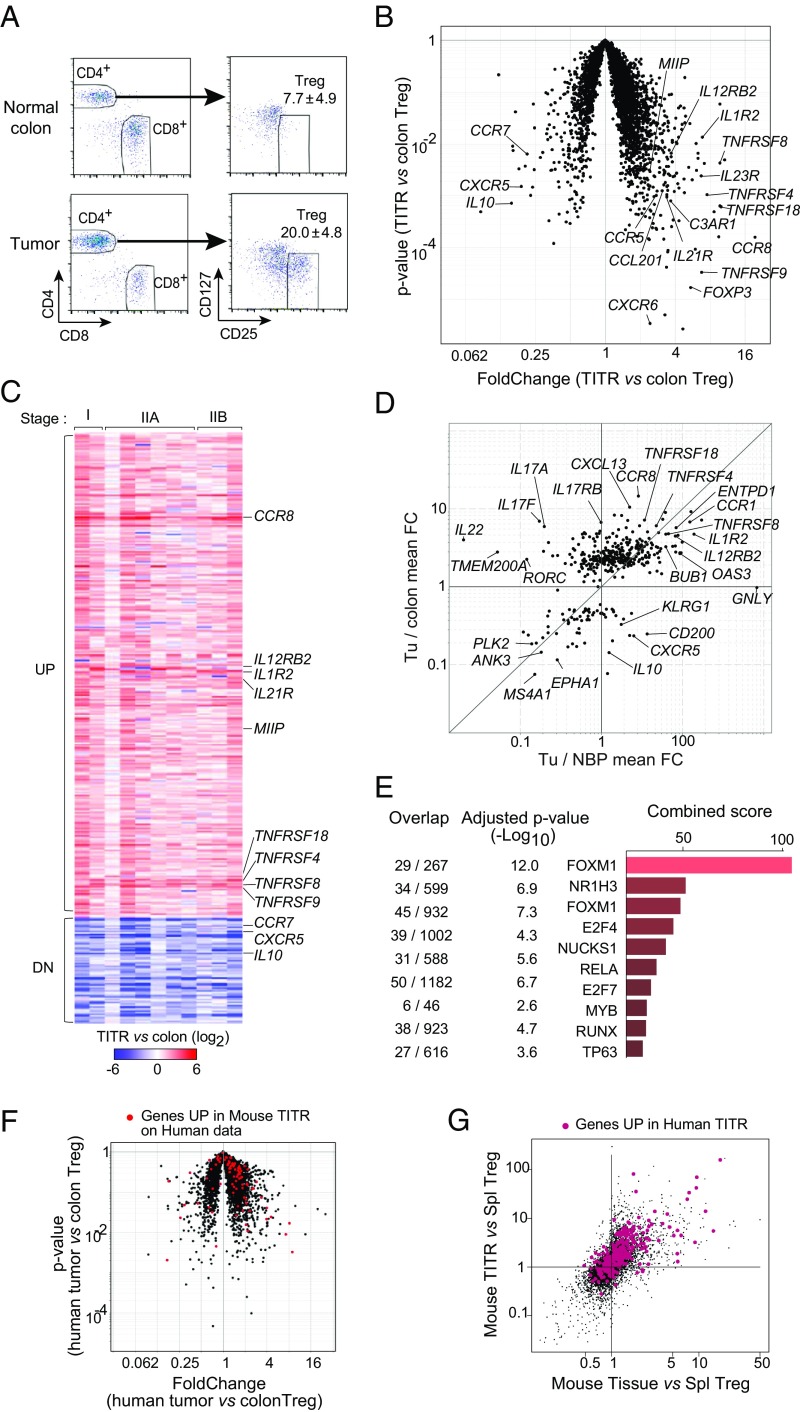
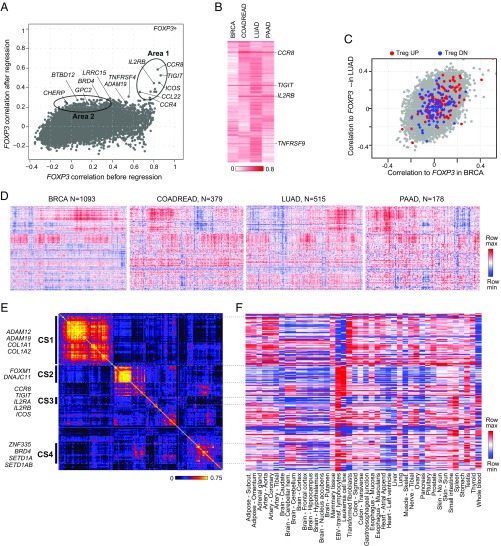
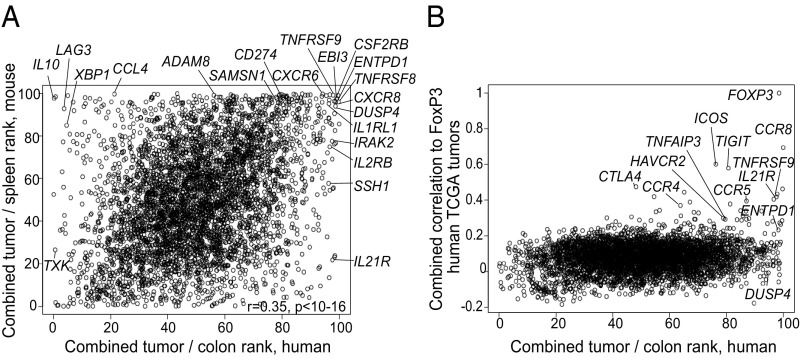
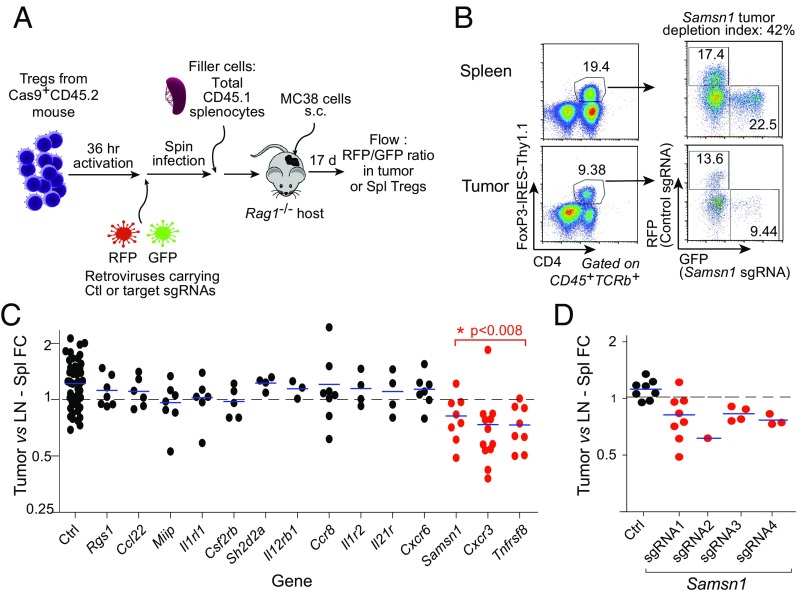
FoxP3+ T regulatory (Treg) cells are central elements of immunologic tolerance. They are abundant in many tumors, where they restrict potentially favorable antitumor responses. We used a three-pronged strategy to identify genes related to the presence and function of Tregs in the tumor microenvironment. Gene expression profiles were generated from tumor-infiltrating Tregs (TITRs) of both human and mouse tumors and were compared with those of Tregs of lymphoid organs or normal tissues from the same individuals. A computational deconvolution of whole-tumor datasets from the Cancer Genome Atlas (TCGA) was performed to identify transcripts specifically associated with Tregs across thousands of tumors from different stages and locations. We identified a set of TITR-differential transcripts with striking reproducibility between tumor types in mice, between mice and humans, and between different human patients spanning tumor stages. Many of the TITR-preferential transcripts were shared with "tissue Tregs" residing in nonlymphoid tissues, but a tumor-preferential segment could be identified. Many of these TITR signature transcripts were confirmed by mining of TCGA datasets, which also brought forth transcript modules likely representing the parenchymal attraction of, or response to, tumor Tregs. Importantly, the TITR signature included several genes encoding effective targets of tumor immunotherapy. A number of other targets were validated by CRISPR-based gene inactivation in mouse Tregs. These results confirm the validity of the signature, generating a wealth of leads for understanding the role of Tregs in tumor progression and identifying potential targets for cancer immunotherapy.

Keywords: T cell differentiation; immuno-oncology; immunotherapy.


Conflict of interest statement

Conflict of interest statement: C.B. co-authored a consortium position paper with Miriam Merad in 2017 that stems from the Human Cell Atlas, a large consortium to which they both belong; they did not collaborate directly on the paper. C.B. is a principal investigator in a bridge funding for a consortium (Immune Cell Atlas), of which Dr. Merad is the Program Director; Dr. Merad’s review of this paper was concluded before this award.

Figures

Fig. 1.
Fig. 1.
Schematic of multipronged work flow. This flowchart describes the generation of our three independent and cross-confirming datasets: (1) Purification and profiling of Treg cells infiltrating three different transplantable tumors in immunocompetent mice; (2) purification of TITR cells from patients with colorectal tumors, and comparison of their gene expression profiles with those of Treg cells purified from normal human colon (many from the same donors); and (3) mining of large datasets from TCGA for genes whose expression correlated with that of the Treg-defining factor FOXP3. Ultimately, these three datasets were combined to identify genes specifically overexpressed in TITRs.
Fig. 2.
Fig. 2.
Identification of TITR signature. (A) Exemplar gating used for FACS of Tregs from three different mouse tumor models: B16, MC38, and CT26. Data are mean ± SD of Treg population size as a percentage total CD4+ T cells. (B) Volcano plots showing the fold change (FC) in gene expression between TITR and splenic Tregs for each of the mouse tumor models examined. Genes with FC in expression ≥3 (red) or ≤−3 (blue) in TITRs vs. splenic Tregs are highlighted and enumerated. (C) FC × FC plots depicting the FC in expression of genes in tumor vs. spleen for one tumor type vs. another tumor type. (Top) B16 × MC38. (Bottom) B16 × CT26. Additive filtered gene sets [genes with FC in expression ≥3 (red) or ≤−3 (blue)] in TITRs vs. splenic Tregs in each of the three transplantable tumor models are highlighted. (D) Comparison of tumor/spleen FC between CD8+ T or CD4+ Tconv cells and Tregs. The additive TITR gene sets described in C are highlighted. (E) Comparison of transcriptomes between TITRs and tissue-resident Tregs. The mean FC in several tissue Tregs (visceral adipose tissue, injured muscle, and colonic lamina propria) relative to splenic Tregs (x-axis) vs. mean FC in TITR relative to splenic Tregs (average of tumor models noted above; y-axis) is shown.
Fig. 3.
Fig. 3.
Conservation of TITR signature across species and individual human CRC patients. (A) Exemplar gating used for FACS of Tregs from patient samples. Data are mean ± SD of Treg population size (as a percentage total CD4+ T cells). (B) Transcriptomic profile of human CRC Tregs vs. normal colonic mucosa Tregs. The plot shows FC and P values for the expression of each gene in tumor/normal colonic Tregs. Annotated genes include some known to be involved in Treg activity and/or costimulation. (C) A total of 408 genes (335 up-regulated, 73 down-regulated) that distinguish TITRs from normal colon Tregs were selected. FC (TITRs/normal colon Tregs) values for these modulated genes for individual patients are shown in the heatmap. (D) Overlap of our TITR transcriptome (408 genes) with a recently published Treg dataset from breast cancer. The mean FC in breast cancer TITRs relative to normal breast parenchyma (NBP) Tregs (x-axis) vs. mean FC in CRC TITRs relative to normal colonic Tregs (y-axis) is shown. (E) Top 10 hits from the Enrichr motif analysis of a gene set preferentially up-regulated in TITRs compared with normal colonic Tregs (335 up-regulated genes). The overlap indicates the number of transcripts from our signature/number of transcripts known to be associated with a given transcription factor. (F) Mouse TITR signature highlighted in red on human tumor/normal colonic Treg data. (G) Human TITR transcripts highlighted in red on mouse tumor/tissue Treg comparison (per Fig. 2E).
Fig. 4.
Fig. 4.
Correlation with FOXP3 in TCGA. (A) Correlation with FOXP3 before and after removal of the immune cell component. Genes with stronger correlation to FOXP3 after immune filtrate removal are highlighted. (B) Correlation with FOXP3 after immune infiltrate removal across four TCGA cancer datasets. (C) Canonical up-regulated and down-regulated Treg signature highlighted on postregression correlation with FOXP3 on LUAD vs. BRCA datasets. (D) Variability of the 219 transcripts with the strongest postregression correlation in the four TCGA datasets. (E) Coexpression matrix of 219 transcripts averaged across four tumors. Four gene sets are highlighted. (F) Tissue expression distribution of 219 transcripts in GTEx.
Fig. 5.
Fig. 5.
Combinatorial data integration. (A) Comparison of overall scores for human (x-axis) and mouse (y-axis) TITRs. Highlighted/annotated are genes either at the top of the ranking in both species, with high scores in the mouse and scores in the top 10% of differential transcripts in human, or highest in the human ranking but not in the mouse ranking. (B) Depiction of overall score for human TITRs (x-axis) vs. average correlation with Foxp3 score derived from the whole-tumor TCGA datasets (y-axis).
Fig. 6.
Fig. 6.
CRISPR-based Treg KOs. (A) Schematic depiction of protocol to induce LOF mutations in TITR target genes, specifically in Treg cells, using the CRISPR/Cas9 system. (B) Exemplar gating used for determining the tumor depletion index, the ratio of the percentage of GFP or RFP+ Tregs in tumor vs. spleen. (C) Summary of CRISPR-based Treg KO data. The tumor depletion index was significant in the genes highlighted in red. (D) Validation of Samsn1 LOF on Treg accumulation in tumors. Four different sgRNAs showed decreased accumulation of Samsn1 LOF Tregs in the tumors.

References

    1. Josefowicz SZ, Lu LF, Rudensky AY. Regulatory T cells: Mechanisms of differentiation and function. Annu Rev Immunol. 2012;30:531–564. - PMC - PubMed
    1. Benoist C, Mathis D. In: Immune Tolerance. Mathis D, Rudensky A, editors. Cold Spring Harbor Press; Cold Spring Harbor, NY: 2013. pp. 31–44.
    1. Brunkow ME, et al. Disruption of a new forkhead/winged-helix protein, scurfin, results in the fatal lymphoproliferative disorder of the scurfy mouse. Nat Genet. 2001;27:68–73. - PubMed
    1. Fontenot JD, Gavin MA, Rudensky AY. Foxp3 programs the development and function of CD4+CD25+ regulatory T cells. Nat Immunol. 2003;4:330–336. - PubMed
    1. Bennett CL, et al. The immune dysregulation, polyendocrinopathy, enteropathy, X-linked syndrome (IPEX) is caused by mutations of FOXP3. Nat Genet. 2001;27:20–21. - PubMed

Publication types