. 2018 Nov 6;115(45):11591-11596.
doi: 10.1073/pnas.1806905115. Epub 2018 Oct 22.

Deep neural network improves fracture detection by clinicians

Affiliations

Deep neural network improves fracture detection by clinicians

Robert Lindsey et al. Proc Natl Acad Sci U S A. .

Abstract

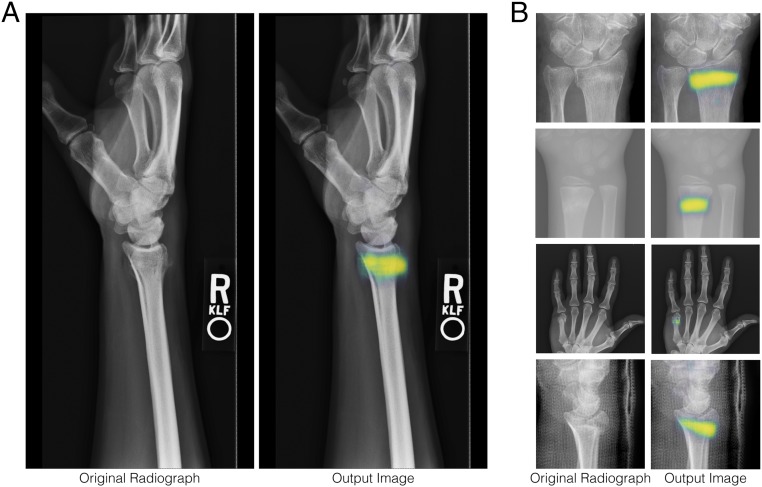
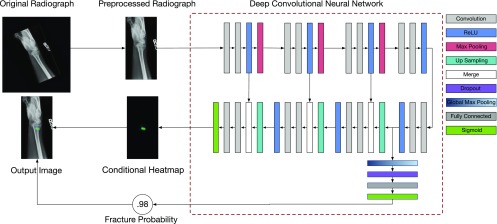
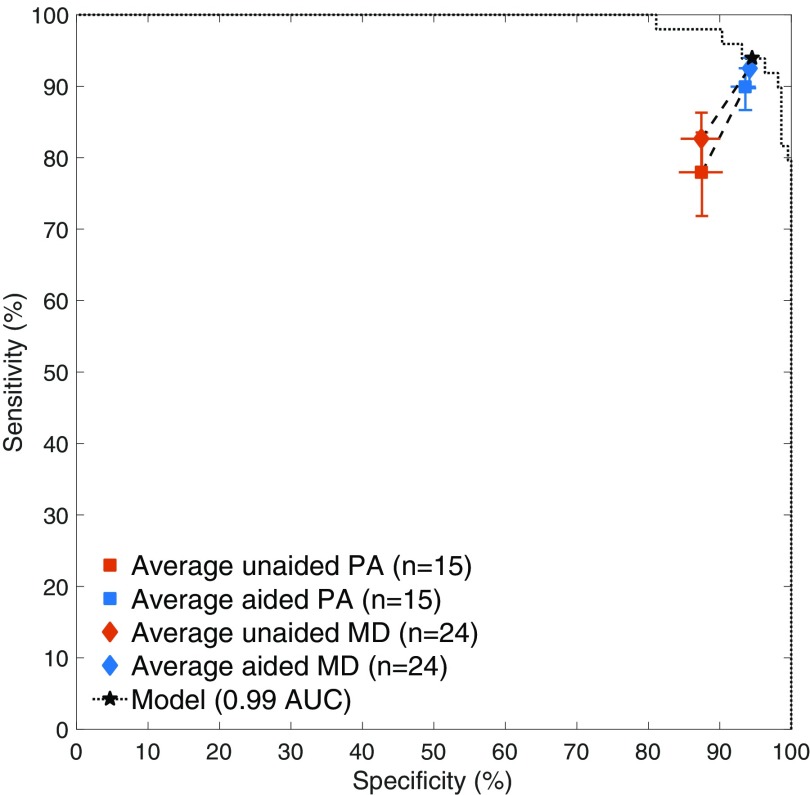
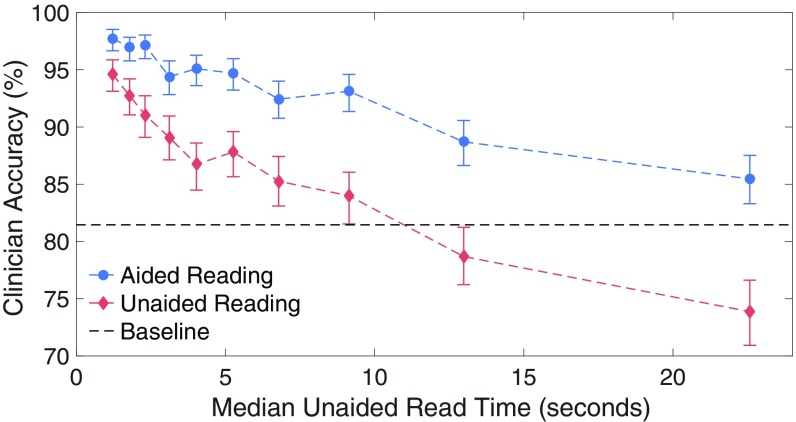
Suspected fractures are among the most common reasons for patients to visit emergency departments (EDs), and X-ray imaging is the primary diagnostic tool used by clinicians to assess patients for fractures. Missing a fracture in a radiograph often has severe consequences for patients, resulting in delayed treatment and poor recovery of function. Nevertheless, radiographs in emergency settings are often read out of necessity by emergency medicine clinicians who lack subspecialized expertise in orthopedics, and misdiagnosed fractures account for upward of four of every five reported diagnostic errors in certain EDs. In this work, we developed a deep neural network to detect and localize fractures in radiographs. We trained it to accurately emulate the expertise of 18 senior subspecialized orthopedic surgeons by having them annotate 135,409 radiographs. We then ran a controlled experiment with emergency medicine clinicians to evaluate their ability to detect fractures in wrist radiographs with and without the assistance of the deep learning model. The average clinician's sensitivity was 80.8% (95% CI, 76.7-84.1%) unaided and 91.5% (95% CI, 89.3-92.9%) aided, and specificity was 87.5% (95 CI, 85.3-89.5%) unaided and 93.9% (95% CI, 92.9-94.9%) aided. The average clinician experienced a relative reduction in misinterpretation rate of 47.0% (95% CI, 37.4-53.9%). The significant improvements in diagnostic accuracy that we observed in this study show that deep learning methods are a mechanism by which senior medical specialists can deliver their expertise to generalists on the front lines of medicine, thereby providing substantial improvements to patient care.

Keywords: CAD; X-ray; deep learning; fractures; radiology.


Conflict of interest statement

Conflict of interest statement: The authors are affiliated with Imagen Technologies, a startup company, the eventual products and services of which will be related to the subject matter of the article. The research was funded by Imagen Technologies. The authors own stock options in the company.

Figures

Fig. 1.
Fig. 1.
A, Left shows a typical radiograph, which is provided as an input to the model. A, Right depicts a heat map overlaid on the radiograph. When the model determines that a fracture is present, the heat map represents the model’s confidence that a particular location is part of the fracture, with yellow and blue being more and less confident, respectively. (B) Close-up views of four additional example inputs and heat map overlays.
Fig. 2.
Fig. 2.
A schematic of how radiographs are processed to detect and localize fractures. An input radiograph is first preprocessed by rotating, cropping, and applying an aspect ratio preserving rescaling operation to yield a fixed resolution of 1,024 × 512. The resulting image is then fed to a DCNN. The architecture of this DCNN is an extension of the U-Net architecture (18). The DCNN has two outputs: (i) the probability that the radiograph has a visible fracture any place in the image and (ii) conditioned on the presence of a fracture, a heat map indicating for each location in the image the probability that the fracture spans that location. When the probability of a fracture is high enough to render a clinical decision in favor of a fracture being present, the CAD system shows users the heat map overlaid on the preprocessed image. More information about the model design and training process can be found in SI Appendix.
Fig. 3.
Fig. 3.
The model accurately detects the presence of visible fractures in wrist radiographs on two separate test datasets. When given a radiograph, one of the model’s outputs is a probability that the patient has a fracture visible in the radiograph. A decision threshold t has to be chosen such that, for any probability value greater than the threshold, the CAD system alerts the clinician. The above curves show, for all possible values of t[0,1], what the corresponding sensitivity (true positive rate) and specificity (true negative rate) of the system would be on that test dataset. The dashed black line restricts the analysis to the subset of Test Set 2, on which there was no interexpert disagreement about the presence or absence of a visible fracture (1,243 of 1,400 radiographs).
Fig. 4.
Fig. 4.
Performance of the emergency medicine clinicians in the experiment. Each clinician read each radiograph first unaided (without the assistance of the model) and then aided (with the assistance of the model). The average clinician’s sensitivities were 80.8% (95% CI, 76.7–84.1%) unaided and 91.5% (95% CI, 89.3–92.9%) aided, and specificities were 87.5% (95% CI, 85.3–89.5%) unaided and 93.9% (95% CI, 92.9–94.9%) aided. The model operated at 93.9% sensitivity and 94.5% specificity (shown as the star) using a decision threshold set on the model development dataset.
Fig. 5.
Fig. 5.
Each point represents a bin containing one-10th of the radiographs used in the experiment. The horizontal location of a point indicates the median unaided response time in seconds for the radiographs within the bin. The vertical location of a point indicates the across-clinician average diagnostic accuracy on the radiographs within the bin. The difference in accuracy between the aided and unaided reading conditions increases with unaided reading time, which is a proxy for the radiograph’s difficulty. The dashed horizontal black line indicates the accuracy that a clinician would have achieved had he or she reported “no fracture” on every radiograph. The aided reading condition never has an average accuracy worse than baseline guessing.

References

    1. Berlin L. Defending the “missed” radiographic diagnosis. Am J Roentgenol. 2001;176:317–322. - PubMed
    1. Hallas P, Ellingsen T. Errors in fracture diagnoses in the emergency department: Characteristics of patients and diurnal variation. BMC Emerg Med. 2006;6:4. - PMC - PubMed
    1. Kachalia A, et al. Missed and delayed diagnoses in the emergency department: A study of closed malpractice claims from 4 liability insurers. Ann Emerg Med. 2007;49:196–205. - PubMed
    1. Wei CJ, et al. Systematic analysis of missed extremity fractures in emergency radiology. Acta Radiologica. 2006;47:710–717. - PubMed
    1. Guly HR. Diagnostic errors in an accident and emergency department. Emerg Med J. 2001;18:263–269. - PMC - PubMed

Publication types

MeSH terms