. 2018 Dec 11;39(1):e00238-18.
doi: 10.1128/MCB.00238-18. Print 2019 Jan 1.

A Tumor-Promoting Phorbol Ester Causes a Large Increase in APOBEC3A Expression and a Moderate Increase in APOBEC3B Expression in a Normal Human Keratinocyte Cell Line without Increasing Genomic Uracils

Affiliations

A Tumor-Promoting Phorbol Ester Causes a Large Increase in APOBEC3A Expression and a Moderate Increase in APOBEC3B Expression in a Normal Human Keratinocyte Cell Line without Increasing Genomic Uracils

Sachini U Siriwardena et al. Mol Cell Biol. .

Abstract

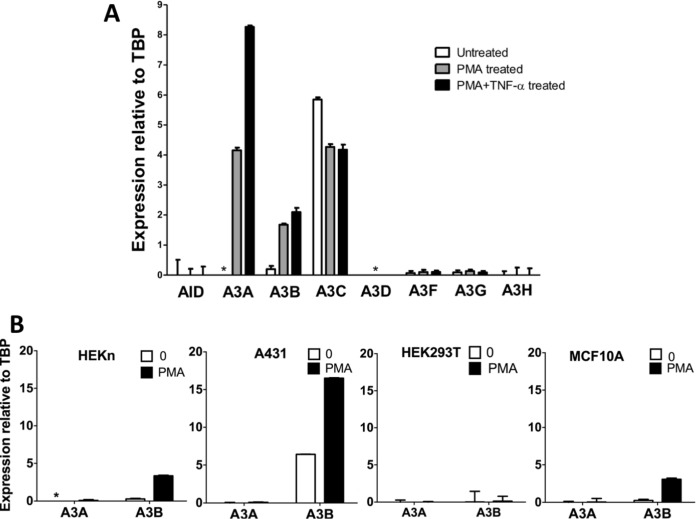
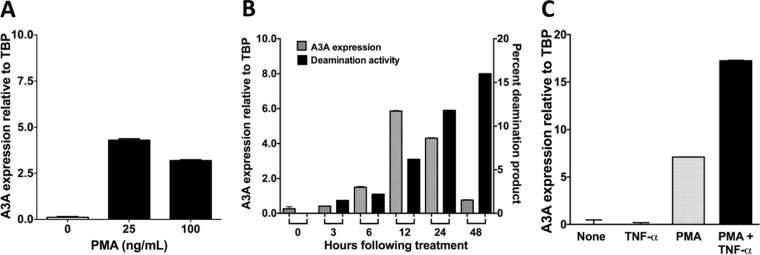
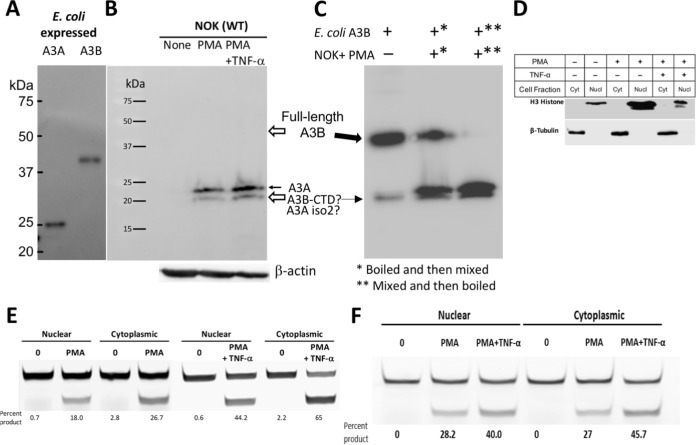
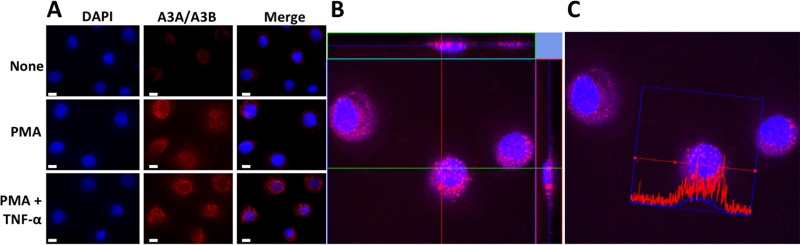
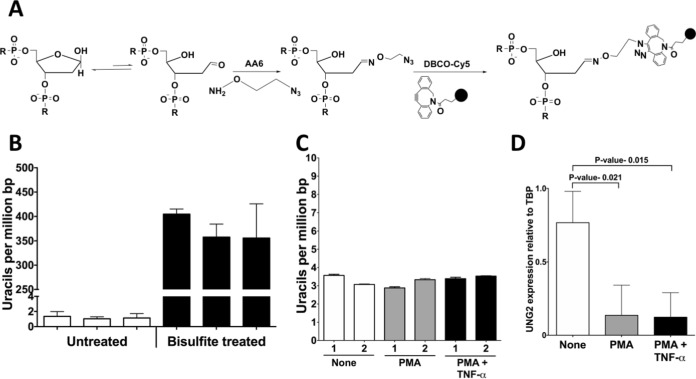
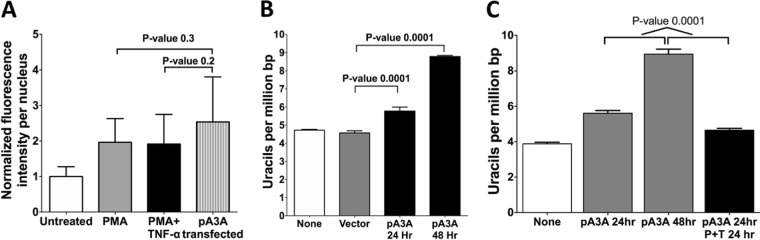
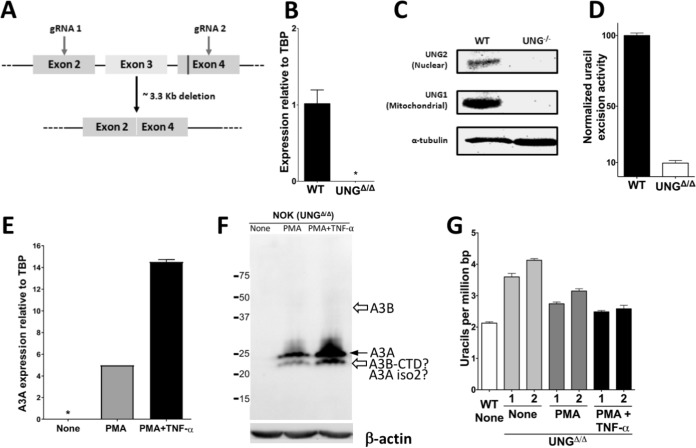
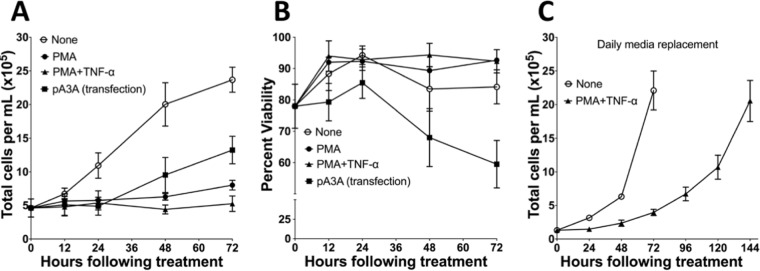
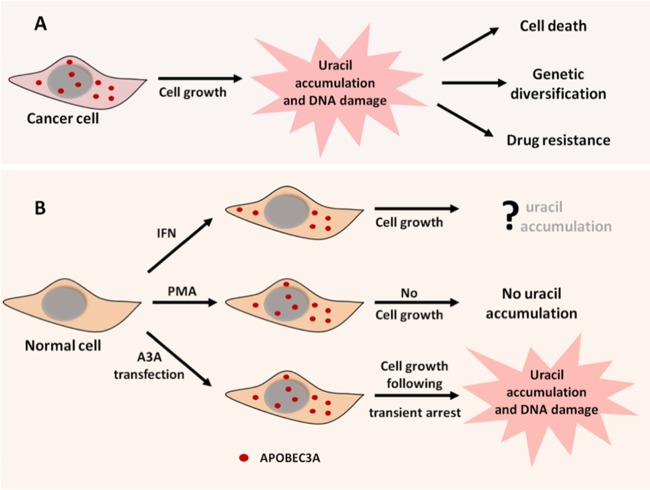
Phorbol 12-myristate 13-acetate (PMA) promotes skin cancer in rodents. The mutations found in murine tumors are similar to those found in human skin cancers, and PMA promotes proliferation of human skin cells. PMA treatment of human keratinocytes increases the synthesis of APOBEC3A, an enzyme that converts cytosines in single-stranded DNA to uracil, and mutations in a variety of human cancers are attributed to APOBEC3A or APOBEC3B expression. We tested here the possibility that induction of APOBEC3A by PMA causes genomic accumulation of uracils that may lead to such mutations. When a human keratinocyte cell line was treated with PMA, both APOBEC3A and APOBEC3B gene expression increased, anti-APOBEC3A/APOBEC3B antibody bound a protein(s) in the nucleus, and nuclear extracts displayed cytosine deamination activity. Surprisingly, there was little increase in genomic uracils in PMA-treated wild-type or uracil repair-defective cells. In contrast, cells transfected with a plasmid expressing APOBEC3A acquired more genomic uracils. Unexpectedly, PMA treatment, but not APOBEC3A plasmid transfection, caused a cessation in cell growth. Hence, a reduction in single-stranded DNA at replication forks may explain the inability of PMA-induced APOBEC3A/APOBEC3B to increase genomic uracils. These results suggest that the proinflammatory PMA is unlikely to promote extensive APOBEC3A/APOBEC3B-mediated cytosine deaminations in human keratinocytes.

Keywords: APOBEC3A; phorbol myristate acetate; psoriasis; replication fork and DNA damage; uracils in DNA.


Figures

FIG 1
FIG 1
Effects of PMA treatment on AID/APOBEC3 gene expression in different human cell lines. (A) qRT-PCR for mRNA expression of AID/APOBEC3s relative to TBP in NOK cells that were either untreated, treated with 25 ng/ml PMA, or treated with 25 ng/ml PMA and 10 ng/ml TNF-α for 24 h. (B) A3A and A3B mRNA expression relative to TBP without treatment (“0”) or after treatment with PMA for 24 h in HEKn, A431, and HEK293T cells and for 6 h in MCF10A cells. In all cases, the means and standard deviations (SD) are shown for triplicate qRT-PCRs. *, not detected.
FIG 2
FIG 2
Optimization of APOBEC3A upregulation by PMA. (A) qRT-PCR for A3A mRNA expression in NOK cells after 24 h of treatment with different doses of PMA. (B) Time-dependent change in A3A mRNA expression and cytosine deamination activity in whole-cell extracts following treatment with 25 ng/ml PMA. The deamination activity is shown as the percentage of substrate DNA made sensitive to strand cleavage by treatment with Ung, followed by NaOH. (C) A3A mRNA levels relative to TBP in NOK cells that were untreated or treated with 10 ng/ml TNF-α alone, 25 ng/ml PMA alone, or PMA+TNF-α for 24 h. For the quantification of gene expression using qRT-PCR, the means and SD are shown from triplicate samples.
FIG 3
FIG 3
Effect of PMA treatment on APOBEC3A and APOBEC3B protein expression and cytosine deamination activity. (A) Western blot of E. coli extract containing A3A or A3B using anti-A3A/A3B antibody. (B) Western blot analysis of whole-cell extracts of NOK cells either untreated (“None”) or treated with PMA or PMA+TNF-α for 24 h using anti-A3A/A3B antibody. The expression level of β-actin was used as a loading control. The position of full-length A3A is indicated by a closed arrow, and the expected positions of full-length A3B and the CTD of A3B are indicated by open arrows. (C) Mixing of E. coli extract containing full-length A3B with extracts of NOK cells treated with PMA. Overloading of E. coli extract (20 μg) in the first lane shows both the full-length A3B and a minor band consistent with the size of A3B-CTD. Both A3B forms are indicated by solid arrows. The order of mixing and boiling of the two extracts is indicated by asterisks in the panel footnotes. (D) Detection of organelle-specific protein markers using antibodies. Blots of cytoplasmic (Cyt) and nuclear (Nucl) extracts from NOK cells that were untreated or treated with PMA or PMA+TNF-α were probed using anti-histone H3 (nuclear marker) or anti-β-tubulin (cytoplasmic marker) antibodies. (E) In vitro cytosine deamination assay for nuclear and cytoplasmic fractions of NOK cells. A fluorescently labeled oligomer containing a single cytosine in 5′-TC context was incubated with the indicated cellular extract, and the uracils created by A3A/A3B were converted to strand breaks by successive treatment with E. coli Ung and NaOH (top band, substrate; bottom band, product). The percentages of cytosines converted to uracils were calculated based on band intensities and are shown below each lane. (F) In vitro cytosine deamination assay for nuclear and cytoplasmic fractions of UNGΔ/Δ NOK cells. The cell fractions were prepared, and the deamination assays were performed in the same manner as described for the UNG+/+ NOK cells.
FIG 4
FIG 4
Subcellular localization of APOBEC3A using confocal microscopy. (A) Representative fluorescence microscopy images of untreated or treated NOK cells stained for A3A (red) and nuclei (blue). Size bars, 10 μm. (B) Confocal microscopy z-stacking images of NOK cells treated with PMA+TNF-α and immunostained for A3A (red) and nuclei (blue). An orthogonal analysis of foci in the nucleus in x-z and y-z planes shows overlap of red and blue. (C) Fluorescence intensity profile from a cell in the confocal image. The red (A3A) and blue (DAPI) intensity traces are shown across one cell.
FIG 5
FIG 5
Genomic uracil levels and UNG2 expression in NOK cells. (A) Principle of the method used for the quantification of genomic uracils. Treatment of DNA with E. coli Ung creates abasic sites which are reacted with an alkoxyamine, AA6, which contains a terminal azide group. This AA6-tagged DNA is reacted with the chemical DBCO-Cy5, and the fluorescence intensity of this DNA is interpolated in a standard plot created using DNA with known amounts of uracils to determine the uracil levels. (B) Reproducibility of uracil quantification. GM31, the DNA repair-proficient strain, contains few uracils and consistently shows about one uracil/106 bp. In contrast, bisulfite treatment of this DNA creates a large number of uracils, which are also quantified by this assay. The data represent three separate quantifications of each DNA sample using two or more replicates. (C) Quantification of genomic uracils in untreated, PMA-treated, or PMA+TNF-α-treated NOK cells after 24 h. The numbers 1 and 2 represent results from two independent experiments. (D) qRT-PCR for mRNA expression of UNG2 (nuclear isoform) relative to TBP in PMA- or PMA+TNF-α-treated NOK cells. In panels B and C, the means and SD are shown.
FIG 6
FIG 6
Effects of transfection of NOK cells with a plasmid expressing A3A. (A) Quantification of the fluorescence intensity in the nuclei of NOK cells that were untreated, treated with PMA, treated with PMA+TNF-α, or transfected with A3A plasmid. The cells were fixed and stained with anti-A3A/A3B antibody. (B) Quantification of genomic uracils in NOK cells transfected with a plasmid expressing A3A or a control plasmid lacking the A3A gene (vector). Uracil levels in A3A-transfected cells harvested at 24 or 48 h are shown. (C) Quantification of genomic uracils in NOK cells that were untreated, transfected with the A3A plasmid, or treated with PMA+TNF-α for 24 h after transfection. The means and SD are shown. The P value was calculated using a two-tailed t test.
FIG 7
FIG 7
Generation, validation, and use of UNGΔ/Δ NOK cell lines. (A) Schematic representation of a part of the human UNG gene and the gRNAs designed to cause a large deletion. The region of exon 4 coding for catalytically important residues of UNG is shown as a vertical line. (B) Quantification of mRNA expression of UNG2 in WT and UNGΔ/Δ NOK cells relative to TBP. *, not detected. (C) Western blot analysis of whole-cell extracts for the expression of two isoforms of the UNG protein in WT and UNG-knockout (UNG–/–) NOK cells. The expression level of α-tubulin was used as a loading control. (D) Normalized uracil excision activity of UNGΔ/Δ NOK cells relative to WT (set to 100). The means and SD are shown. The activity was determined by incubating an oligomer containing a single uracil with whole-cell extracts, followed by cleavage at the resulting abasic sites and gel electrophoresis. (E) Expression of A3A in UNGΔ/Δ NOK cells that were either untreated, treated with PMA, or treated with PMA+TNF-α as determined by qRT-PCR. (F) Western blot analysis of whole-cell extracts of UNGΔ/Δ NOK cells that were either untreated (“None”) or treated with PMA or PMA+TNF-α for 24 h using anti-A3A/A3B antibody. The expression level of β-actin was used as a loading control. The position of full-length A3A is shown by a closed arrow, and the expected positions of full-length A3B and the CTD of A3B are indicated by open arrows. (G) Comparison of genomic uracils in untreated WT cells to those in untreated, PMA-treated, or PMA+TNF-α-treated UNGΔ/Δ NOK cells for 24 h. The numbers 1 and 2 indicate two independent UNGΔ/Δ clones. The means and SD are shown.
FIG 8
FIG 8
Effects of PMA treatment or A3A transfection on NOK cell growth and viability. (A and B) Comparison of the change in total cell number (A) and the viability (B) of NOK cells that were untreated, PMA treated, PMA+TNF-α treated, or transfected with a plasmid expressing A3A. (C) Comparison of the change in total cell number of untreated or PMA+TNF-α-treated NOK cells with daily medium replacement. The means and SD are shown for each data point.
FIG 9
FIG 9
Consequences of APOBEC3A expression in cancer cells and normal cells. (A) In rapidly dividing cancer cells, A3A expression causes an increase in genomic uracils, resulting in genome instability. (B) The outcomes of A3A expression in normal cells depend on the mode of A3A induction and the state of cell growth. The upper branch of the diagram shows A3A localized exclusively in the cytoplasm and preventing DNA damage. The middle branch shows A3A in both the cytoplasm and the nucleus and shows how growth arrest protects the genome from A3A. The lower branch shows the results of the nonphysiological expression of A3A, resulting in extensive DNA damage due to continued DNA replication or growth arrest in the S phase.

Similar articles

Cited by

References

    1. Furstenberger G, Berry DL, Sorg B, Marks F. 1981. Skin tumor promotion by phorbol esters is a two-stage process. Proc Natl Acad Sci U S A 78:7722–7726. doi:10.1073/pnas.78.12.7722. - DOI - PMC - PubMed
    1. Griner EM, Kazanietz MG. 2007. Protein kinase C and other diacylglycerol effectors in cancer. Nat Rev Cancer 7:281–294. doi:10.1038/nrc2110. - DOI - PubMed
    1. Spitaler M, Cantrell DA. 2004. Protein kinase C and beyond. Nat Immunol 5:785–790. doi:10.1038/ni1097. - DOI - PubMed
    1. Rundhaug JE, Fischer SM. 2010. Molecular mechanisms of mouse skin tumor promotion. Cancers (Basel) 2:436–482. doi:10.3390/cancers2020436. - DOI - PMC - PubMed
    1. Schwarz M, Munzel PA, Braeuning A. 2013. Non-melanoma skin cancer in mouse and man. Arch Toxicol 87:783–798. doi:10.1007/s00204-012-0998-9. - DOI - PubMed

Publication types

LinkOut - more resources