. 2018 Oct 22;373(1761):20170433.
doi: 10.1098/rstb.2017.0433.

Measuring rewilding progress

Affiliations

Measuring rewilding progress

Aurora Torres et al. Philos Trans R Soc Lond B Biol Sci. .

Erratum in

  • Correction to 'Measuring rewilding progress'.
    Torres A, Fernández N, Zu Ermgassen S, Helmer W, Revilla E, Saavedra D, Perino A, Mimet A, Rey-Benayas JM, Selva N, Schepers F, Svenning JC, Pereira HM. Torres A, et al. Philos Trans R Soc Lond B Biol Sci. 2019 Feb 4;374(1765):20180568. doi: 10.1098/rstb.2018.0568. Philos Trans R Soc Lond B Biol Sci. 2019. PMID: 30967010 Free PMC article. No abstract available.

Abstract

Rewilding is emerging as a promising restoration strategy to enhance the conservation status of biodiversity and promote self-regulating ecosystems while re-engaging people with nature. Overcoming the challenges in monitoring and reporting rewilding projects would improve its practical implementation and maximize its conservation and restoration outcomes. Here, we present a novel approach for measuring and monitoring progress in rewilding that focuses on the ecological attributes of rewilding. We devised a bi-dimensional framework for assessing the recovery of processes and their natural dynamics through (i) decreasing human forcing on ecological processes and (ii) increasing ecological integrity of ecosystems. The rewilding assessment framework incorporates the reduction of material inputs and outputs associated with human management, as well as the restoration of natural stochasticity and disturbance regimes, landscape connectivity and trophic complexity. Furthermore, we provide a list of potential activities for increasing the ecological integrity after reviewing the evidence for the effectiveness of common restoration actions. For illustration purposes, we apply the framework to three flagship restoration projects in the Netherlands, Switzerland and Argentina. This approach has the potential to broaden the scope of rewilding projects, facilitate sound decision-making and connect the science and practice of rewilding.This article is part of the theme issue 'Trophic rewilding: consequences for ecosystems under global change'.

Keywords: biodiversity; ecological processes; ecosystem integrity; ecosystem management; monitoring; restoration.


Conflict of interest statement

W.H., D.S. and F.S. work at Rewilding Europe. They have endeavoured to be as honest and balanced as possible and to write in the spirit of academic discussion rather than organizational promotion.

Figures

Figure 1.
Figure 1.
Bi-dimensional space representing the condition of the system along axes of human input and output forcing (H) and ecological integrity of ecosystems (E). Background colours represent the values of the rewilding score quantified through equation (2.3). (a) Conceptual illustration showing the position of common land uses in this bi-dimensional naturalness space. (b) Scheme of how changes in either dimension can lead to changes in overall system condition, although improvements in both dimensions are typically required to maximize the rewilding score. (Online version in colour.)
Figure 2.
Figure 2.
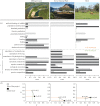
Panel showing the results of applying the rewilding assessment framework to three projects, namely the Millingerwaard project (the Netherlands); the Swiss National Park (Switzerland); and the Iberá project (Argentina). (a) Scores obtained for the variables at the beginning of the project and at present. A description of the variables and indicators is available in table 1 and electronic supplementary material, table S1. (b) Representation of the estimated scores of direct human inputs and outputs (H) and ecological integrity of ecosystems (E) in the bi-dimensional framework for each case study. d variables represent the naturalness of disturbances and stochastic events, c variables represent landscape composition and connectivity and t variable represents the trophic complexity. The arrows indicate the trajectory of change from the beginning of the projects to present. The rewilding score (R) is placed next to each point in time and has been calculated on the basis of the scores shown in (a). Photographs courtesy of Rijkswaterstaat, SNP/H. Lozza and N. Fernández. (Online version in colour.)

References

    1. Hallmann CA, et al. 2017. More than 75 percent decline over 27 years in total flying insect biomass in protected areas. PLoS ONE 12, e0185809 (10.1371/journal.pone.0185809) - DOI - PMC - PubMed
    1. Ceballos G, Ehrlich PR, Dirzo R. 2017. Biological annihilation via the ongoing sixth mass extinction signaled by vertebrate population losses and declines. Proc. Natl Acad. Sci. USA 114, E6089–E6096. (10.1073/pnas.1704949114) - DOI - PMC - PubMed
    1. Hansen MC, et al. 2013. High-resolution global maps of 21st-century forest cover change. Science 342, 850–853. (10.1126/science.1244693) - DOI - PubMed
    1. Dirzo R, Young HS, Galetti M, Ceballos G, Isaac NJB, Collen B. 2014. Defaunation in the Anthropocene. Science 345, 401–406. (10.1126/science.1251817) - DOI - PubMed
    1. Benayas JMR, Bullock JM. 2012. Restoration of biodiversity and ecosystem services on agricultural land. Ecosystems 15, 883–899. (10.1007/s10021-012-9552-0) - DOI

Publication types

LinkOut - more resources