. 2018 Dec 14;293(50):19411-19428.
doi: 10.1074/jbc.RA118.005401. Epub 2018 Oct 22.

Phosphatidylinositol 4,5-bisphosphate (PIP2) regulates KCNQ3 K+ channels by interacting with four cytoplasmic channel domains

Affiliations

Phosphatidylinositol 4,5-bisphosphate (PIP2) regulates KCNQ3 K+ channels by interacting with four cytoplasmic channel domains

Frank S Choveau et al. J Biol Chem. .

Abstract

Phosphatidylinositol 4,5-bisphosphate (PIP2) in the plasma membrane regulates the function of many ion channels, including M-type (potassium voltage-gated channel subfamily Q member (KCNQ), Kv7) K+ channels; however, the molecular mechanisms involved remain unclear. To this end, we here focused on the KCNQ3 subtype that has the highest apparent affinity for PIP2 and performed extensive mutagenesis in regions suggested to be involved in PIP2 interactions among the KCNQ family. Using perforated patch-clamp recordings of heterologously transfected tissue culture cells, total internal reflection fluorescence microscopy, and the zebrafish (Danio rerio) voltage-sensitive phosphatase to deplete PIP2 as a probe, we found that PIP2 regulates KCNQ3 channels through four different domains: 1) the A-B helix linker that we previously identified as important for both KCNQ2 and KCNQ3, 2) the junction between S6 and the A helix, 3) the S2-S3 linker, and 4) the S4-S5 linker. We also found that the apparent strength of PIP2 interactions within any of these domains was not coupled to the voltage dependence of channel activation. Extensive homology modeling and docking simulations with the WT or mutant KCNQ3 channels and PIP2 were consistent with the experimental data. Our results indicate that PIP2 modulates KCNQ3 channel function by interacting synergistically with a minimum of four cytoplasmic domains.

Keywords: KCNQ; M current; PIP2; ion channel gating; ion channel modulation; lipid signaling; neuroscience; phospholipid; potassium channel; signal transduction; structure-function.


Conflict of interest statement

The authors declare that they have no conflicts of interest with the contents of this article

Figures
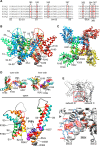
Figure 1.
Figure 1.
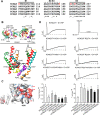
Location of the site(s) of PIP2 action on KCNQ3 channels. A, sequence alignments of human KCNQ channels of the putative PIP2-interaction domains studied in this work. The residues highlighted in red are conserved basic residues across all KCNQ channels. Structural domains where the putative PIP2-interacting residues are located are indicated below the alignments as solid lines (α-helices) and noncontinuous lines (linkers). B and C, three-dimensional structural models of the open conformation of the KCNQ3 channel in a ribbon representation, colored by subunits as viewed from the membrane plane (B) and the intracellular side (C). Conserved basic residues Arg190, Arg195, Arg242, His257, Lys358, and Arg364 tested in this study by mutagenesis are shown in gray and mapped onto the channel. D, ribbon representations of the arrangement of the VSD–PD interface of a structural subunit model viewed from the outer and inner side (top panels), and membrane plane (bottom panels). The secondary structure of the channels is colored according to structural domain, as indicated. Side chains of basic residues involved in PIP2 interactions are shown in color, according to structural domain (gray for the S2–S3 linker and S6Jx and purple for the S4–S5 linker). The PIP2 molecule is shown in a molecular surface representation within the docking cavity. E, expanded view of the most favorable binding model of PIP2 in the open conformation. Panels show two neighboring subunits (Sub) forming the VSD–PD interface (Sub-C and Sub-D). The docking site enclosed in a red box was enlarged for clarity. Shown in a stick representation are the residues forming hydrogen bonds and electrostatic interactions within the interaction site. Residues in blue from the Sub-D enclose the phosphate groups of PIP2, and residues in orange from the Sub-C enclose the acyl tail of the PIP2 between Sub-C and Sub-D at the S6Jx. The following are the favorable interactions (labeled in red) predicted to be in the PIP2-docking network (<6.0 Å, kJ/mol): Arg242 = −12.26, Arg243 = −4.60, His257 = −1.10, Lys358 = −4.28, Lys366 = −5.74. Hydrogen bonds are not shown.
Figure 2.
Figure 2.
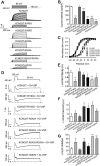
Effects of charge-neutralizing mutations located in the S2–S3 and S4–S5 linkers on KCNQ3T channels. A, representative perforated patch-clamp recordings from CHO cells transfected with KCNQ3T or the indicated mutant channels. B, bars show summarized current densities at 60 mV for the indicated channels (n = 6–19). C, voltage dependence of activation of the tail currents at −60 mV, plotted as a function of test potential (n = 5–19). D, representative perforated patch-clamp recordings from CHO cells co-transfected with Dr-VSP and KCNQ3T or the indicated mutant channels. E, bars summarize time constant values from single exponential fits to current decay during Dr-VSP activation (n = 5–10). F, bars summarize time constants of single exponential fits to current recovery after Dr-VSP turn-off (n = 5–11). G, bars summarize fractional inhibition after M1R stimulation for the indicated mutant channels (n = 3–7). *, p < 0.05; **, p < 0.01; ***, p < 0.001. Error bars, S.E.
Figure 3.
Figure 3.
Effects of charge neutralizing mutations located in the S6Jx domain on KCNQ3T channels. A, representative perforated patch-clamp recordings from KCNQ3T and mutant channels. B, bars show summarized current densities at 60 mV for the indicated channels (n = 6–19). C, voltage dependence of activation of the tail currents at −60 mV, plotted as a function of test potential (n = 6–19). D, representative perforated patch-clamp recordings from CHO cells co-transfected with Dr-VSP and KCNQ3T or mutant KCNQ3T channels. E, bars summarize time constants from single-exponential fits to current decay during Dr-VSP activation (n = 5–10). F, bars summarize time constants from single-exponential fits to recovery after Dr-VSP turn-off (n = 5–11). The current traces from KCNQ3T in A and D are from the same cell as in Fig. 2 (A and D), and the summarized data for KCNQ3T in B–F are the same as in Fig. 2, as these data serve as the baseline for all of the sets of mutants shown in Figs. 2–4. KCNQ3T and all mutants were tested contemporaneously. **, p < 0.01; ***, p < 0.001. Error bars, S.E.
Figure 4.
Figure 4.
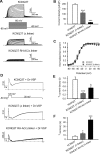
Effects of the A–B linker deletion on KCNQ3T channels. A, representative perforated patch-clamp recordings from cells expressing Dr-VSP and either KCNQ3T, KCNQ3T (Δ linker), or KCNQ3T (RH-AC/Δ linker) channels. Cells were held at −80 mV, and voltage steps were applied from −80 to 60 mV in 10-mV increments every 3 s. B, bars show summarized current densities at 60 mV for the indicated channels (n = 8–19). C, shown are the amplitude of tail currents at −60 mV, plotted as a function of test potential from KCNQ3T and KCNQ3T (Δ linker) channels (n = 11–19). D, representative perforated patch-clamp recordings from CHO cells co-transfected with Dr-VSP and KCNQ3T or KCNQ3T (Δ linker) or the RH-AC/Δ linker mutants. E, bars summarize time constants from single-exponential fits to current decay during Dr-VSP activation (n = 6–10). F, bars summarize time constants from single-exponential fits to recovery after Dr-VSP turn-off (n = 6–11). The current traces from KCNQ3T in A and D are from the same cell as in Fig. 2, A and D, and the summarized data for KCNQ3T in B–F are the same as in Fig. 2, as these data serve as the baseline for all of the sets of mutants shown in Figs. 2–4. KCNQ3T and all mutants were tested contemporaneously. *, p < 0.05; ***, p < 0.001. Error bars, S.E.
Figure 5.
Figure 5.
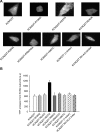
TIRF microscopy indicates that mutants in PIP2-interacting domains result in minor differences in membrane expression of channels. A, fluorescent images under TIRF illumination of CHO cells expressing the indicated enhanced YFP–tagged channels. B, bars show summarized emission intensity data for each channel type (n = 32–60). Error bars, S.E.
Figure 6.
Figure 6.
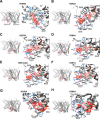
Charge-neutralizing mutations at the S2–S3 and S4–S5 linkers and S6Jx are predicted to disrupt PIP2 interactions of KCNQ3 channels. Shown are three-dimensional structural models of the most favorable docking PIP2-docking conformation of the KCNQ3 channel after simulation of charge neutralization at the putative PIP2-binding site residues Arg190 in the S2–S3 linker (A); Arg242 and His257 in the S4–S5 linker (B and C); and Arg364, Lys358-Arg364-Lys366 (KRK/AAA), and His367 within the S6Jx (D–F). As indicated in Fig. 1, binding sites are enclosed in red boxes and enlarged for clarity in the right panels. The top panels show two neighboring subunits (Sub-C and Sub-D) or a single subunit forming the binding site. The following are the favorable interactions (labeled in red) predicted to be in the PIP2-docking network (<6.0 Å, kJ/mol): R190A in A, Arg242 = −4.80, Arg243 = −2.40, Lys358 = −4.31; R242A in B, Arg243 = −24.9, His363 = −4.07, Lys366 = −7.63; H257N in C, Arg242 = −18.8, Arg243 = −5.41, Lys358 = −3.11, Lys366 = −7.52; R364A in D, Arg242 = −12.80, Arg243 = −4.54, Lys358 = −3.20; KRK/AAA in E, Arg242 = −27.20, Arg243 = −3.73, His257 = −1.23; H367A in F, Arg242 = −10.3, Arg243 = −3.53, Lys358 = −5.08; K358A in G, Arg242 = −7.43, Arg243 = −2.57, His257 = −5.42; K366A in H, Arg242 = −4.62, Arg243 = −2.03, His257 = −4.34, Lys358 = −2.78. Error bars, S.E.
Figure 7.
Figure 7.
Effects of charge neutralization of residues predicted within the PIP2 docking site of KCNQ3 in the closed state. A, sequence alignments of human KCNQ channels show the additional basic residues Lys103, Arg188, Arg227, and Arg230 tested in this study by mutagenesis. The predicted secondary structure of the channel is indicated above the alignments as solid lines (α-helices) and noncontinuous lines (linkers). B, ribbon representations of the arrangement of the VSD–PD interface of a structural subunit model viewed from the outer and inner side (upper panels) and membrane plane (bottom panels). The secondary structures of the channels and PIP2 molecules are shown as in Fig. 1. C, expanded view of the most favorable interaction predicted of PIP2 in the closed-channel state. The phosphate group of the PIP2 is oriented toward the S2–S3 linker, whereas the acyl tail is enclosed within the α-helices. The following are the favorable interactions (labeled in red) predicted to be in the PIP2-docking network (<6.0 Å): Lys103 = −4.03, Arg188 = −1.44, Arg190 = −1.52, Arg227 = −3.23, Arg230 = −5.36. D, top, representative perforated patch-clamp recordings from CHO cells co-transfected with Dr-VSP and KCNQ3T or the indicated mutants. Cells were held at −60 mV, current decay was measured at 100 mV, and recovery of the current was measured at 0 mV after the depolarization to 100 mV. Note the larger amplitude of the recovery current in these experiments after turn-off of Dr-VSP, due to the voltage used (0 mV), at which the “leak” current is expected to be minimal, compared with +30 mV. Bottom, bars summarize the data from these experiments (n = 5–11). *, p < 0.05; **, p < 0.01. Error bars, S.E.

References

    1. Jentsch T. J. (2000) Neuronal KCNQ potassium channels: physiology and role in disease. Nat. Rev. Neurosci. 1, 21–30 10.1038/35036198 - DOI - PubMed
    1. Suh B. C., and Hille B. (2002) Recovery from muscarinic modulation of M current channels requires phosphatidylinositol 4,5-bisphosphate synthesis. Neuron 35, 507–520 10.1016/S0896-6273(02)00790-0 - DOI - PubMed
    1. Loussouarn G., Park K. H., Bellocq C., Baró I., Charpentier F., and Escande D. (2003) Phosphatidylinositol-4,5-bisphosphate, PIP2, controls KCNQ1/KCNE1 voltage-gated potassium channels: a functional homology between voltage-gated and inward rectifier K+ channels. EMBO J. 22, 5412–5421 10.1093/emboj/cdg526 - DOI - PMC - PubMed
    1. Zhang H., Craciun L. C., Mirshahi T., Rohács T., Lopes C. M., Jin T., and Logothetis D. E. (2003) PIP2 activates KCNQ channels, and its hydrolysis underlies receptor-mediated inhibition of M currents. Neuron 37, 963–975 10.1016/S0896-6273(03)00125-9 - DOI - PubMed
    1. Li Y., Gamper N., Hilgemann D. W., and Shapiro M. S. (2005) Regulation of Kv7 (KCNQ) K+ channel open probability by phosphatidylinositol 4,5-bisphosphate. J. Neurosci. 25, 9825–9835 10.1523/JNEUROSCI.2597-05.2005 - DOI - PMC - PubMed

Publication types

Substances

LinkOut - more resources