. 2018 Oct 22;9(1):4369.
doi: 10.1038/s41467-018-06686-0.

Inhibition of glucose metabolism selectively targets autoreactive follicular helper T cells

Affiliations

Inhibition of glucose metabolism selectively targets autoreactive follicular helper T cells

Seung-Chul Choi et al. Nat Commun. .

Abstract

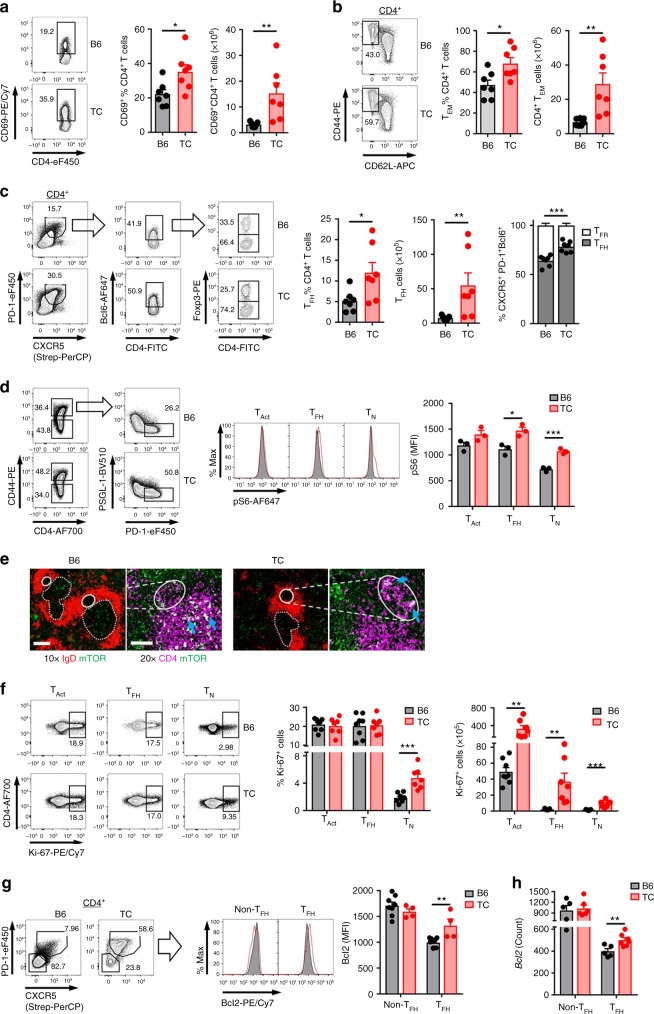
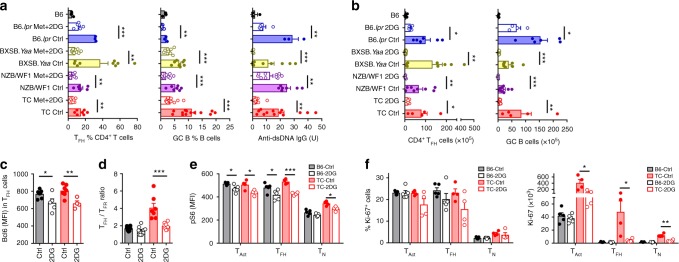
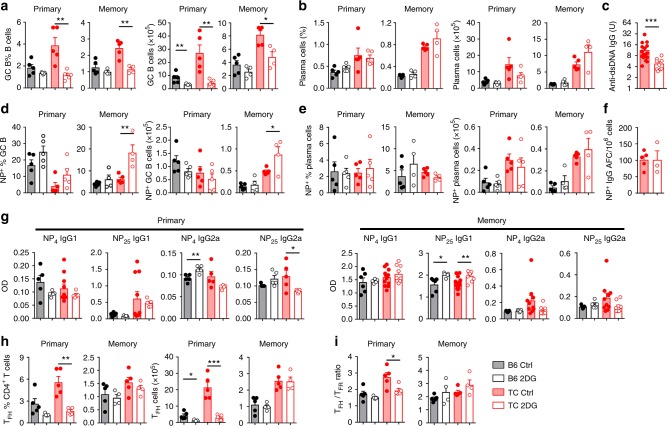
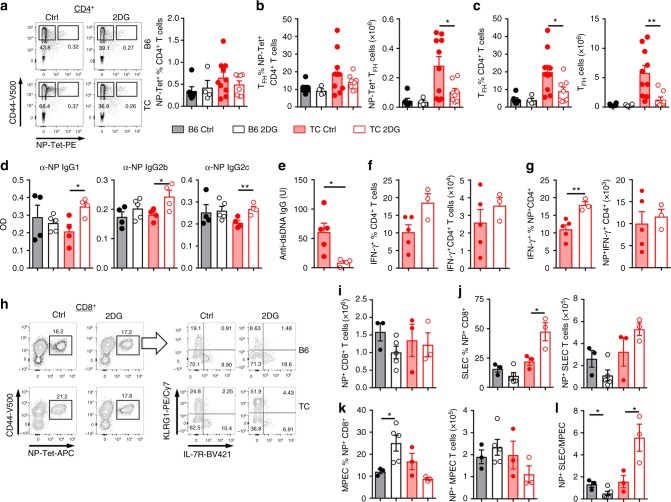
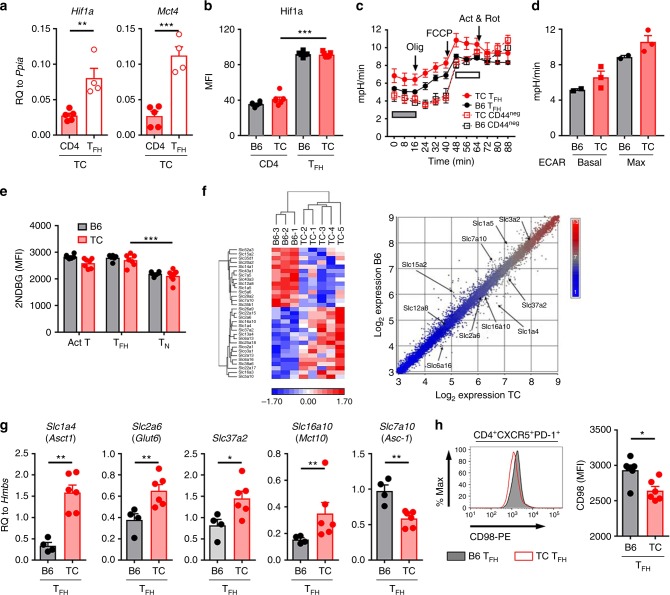
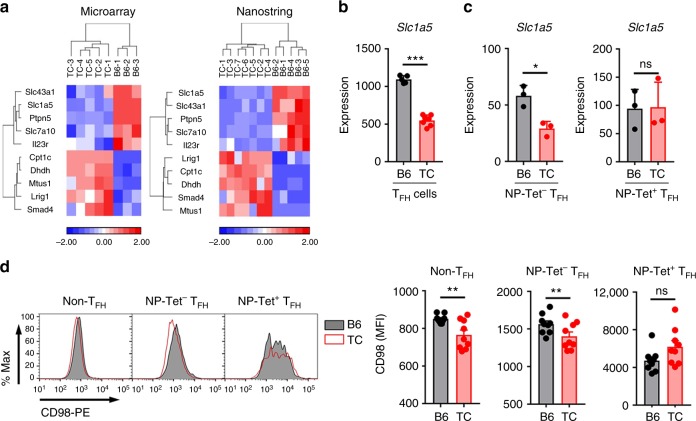
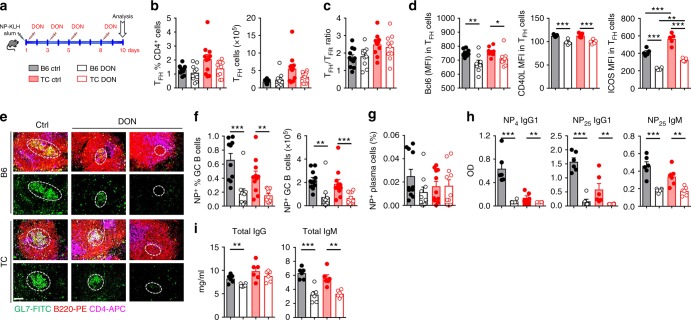
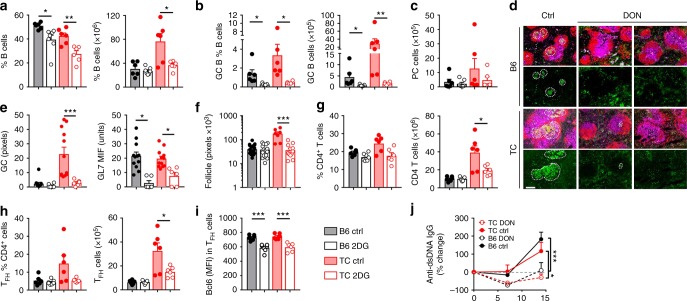
Follicular helper T (TFH) cells are expanded in systemic lupus erythematosus, where they are required to produce high affinity autoantibodies. Eliminating TFH cells would, however compromise the production of protective antibodies against viral and bacterial pathogens. Here we show that inhibiting glucose metabolism results in a drastic reduction of the frequency and number of TFH cells in lupus-prone mice. However, this inhibition has little effect on the production of T-cell-dependent antibodies following immunization with an exogenous antigen or on the frequency of virus-specific TFH cells induced by infection with influenza. In contrast, glutaminolysis inhibition reduces both immunization-induced and autoimmune TFH cells and humoral responses. Solute transporter gene signature suggests different glucose and amino acid fluxes between autoimmune TFH cells and exogenous antigen-specific TFH cells. Thus, blocking glucose metabolism may provide an effective therapeutic approach to treat systemic autoimmunity by eliminating autoreactive TFH cells while preserving protective immunity against pathogens.


Conflict of interest statement

The authors declare no competing interests.

Figures

Fig. 1
Fig. 1
Increased mTORC1 activity and survival in TC TFH cells. ac Frequency and cell number of CD69+ (a), CD4+CD44+CD62L TEM cells (b), and CD4+CXCXR5+PD1+Bcl6+Foxp3 TFH (c) in CD4+ T cells, with the relative distribution of TFH and Foxp3+ TFR cells in CD4+CXCXR5+PD1+Bcl6+ cells. d Mean fluorescence intensity (MFI) of phospho-S6 in TN cells (CD4+CD44), TAct cells (CD4+CD44+), and TFH cells (CD4+CD44+PD-1hiPSGL-1lo). e Representative mTOR staining (green) in the GC (plain line) and T cell zone (dashed line) relative to non-GC B cells (IgD+ red) and CD4+ T cells (purple). Arrows point to examples of mTOR staining. Scale bars: 200 μM for 10× and 10 μM for 20×. f Frequency and number of Ki-67+ proliferating TN, TAct, and TFH cells. g Bcl2 MFI in CD4+CXCXR5+PD1+ TFH and CD4+CXCXR5PD1 non-TFH cells, with representative FACS plots on the left. h Bcl2 mRNA expression in TFH and non-TFH cells as determined with a Nanostring custom panel. Spleens from 9-month-old B6 and TC mice, mean + s.e.m. of N = 3–8 mice per group compared with t tests. *P < 0.05, **P < 0.01, and ***P < 0.001
Fig. 2
Fig. 2
Autoreactive TFH cells are sensitive to glycolysis inhibition. Frequency (a) and cell number (b) of TFH cells (left, CD4+CXCXR5+PD1+Bcl6+Foxp3) in CD4+ T cells and GC B cells (middle, B220+GL7+FAS+) in B cells, as well as serum anti-dsDNA IgG (right) in four strains of lupus-prone mice treated with 2DG for 8 weeks starting at 5–6 months of age, as compared to untreated age-matched controls. Contemporaneous untreated B6 mice are shown as reference. Mean + s.e.m. of N = 3–28 mice per group. cf 3–4-month-old B6 and TC mice were treated 2DG or not for 1 month. MFI of Bcl6 in TFH cells (c) and the ratio of TFH (CD4+CXCXR5+PD1+Bcl6+Foxp3) to TFR (CD4+CXCXR5+PD1+Bcl6+Foxp3+) cells (d). Phospho-S6 (e) as well as frequency and number of Ki-67+ (f) cells in TN cells (CD4+ CD44), TAct cells (CD4+CD44+), and TFH cells (CD4+CD44+PD-1hiPSGL-1lo). Mean + s.e.m. of N = 4–9 spleens per group compared with t tests. *P < 0.05, **P < 0.01, and ***P < 0.001
Fig. 3
Fig. 3
Glycolysis inhibition does not affect the TD-humoral response. After pre-treatment with 2DG for 2 weeks, 8–10-week-old B6 and TC mice were immunized with NP-KLH in alum and maintained under 2DG treatment until sacrifice. Mice were analyzed 10 d after immunization (primary), or 7 weeks after the first immunization following 2 boosts with same antigen 2 and 6 weeks after the primary immunization (memory). Frequency and number of total (a, b) or NP-specific (d, e) GC B cells and plasma cells (gating shown in supplementary Fig. 3). Serum anti-dsDNA IgG (c) and NP-specific IgG antibody-forming cells (f) in TC mice in the memory response. g Serum levels of high-affinity anti-NP4 and low-affinity anti-NP25 IgG1 and IgG2a in the primary (left) and memory (right) responses. Frequency and number of splenic TFH cells (h) and TFH/TFR cell ratio (i) in the primary and memory responses. All cell analyses were performed with splenocytes. Mean + s.e.m. of N = 5 mice per group compared with t tests. *P < 0.05, **P < 0.01, and ***P < 0.001. For simplification, statistical differences between strains are not shown
Fig. 4
Fig. 4
Glycolysis inhibition does not impair the humoral response to influenza immunization. 8–10-week-old B6 and TC mice were infected with PR8 influenza virus. 2DG treatment was initiated 2 weeks before infection and maintained until termination. CD4+ and CD8+ T cells were analyzed 10 d after infection. a Representative FACS plot (left) and percentage (right) of splenic influenza virus-specific CD4+ T cells (CD4+CD44+NP-Tetpos). b, c Frequency and number of CD4+CD44+PD-1hiPSGL-1lo TFH cells in PR8 virus-specific NP-TetposCD4+ T cells (b) and in total CD4+ T cells (c). Serum levels of PR8 NP-specific IgG1, IgG2b and IgG2c (d), and anti-dsDNA IgG (e) 30 d after low dose infection. f, g Frequency and number of IFNγ+ in total CD4+ T cells (f) and PR8 virus-specific NP-TetposCD4+ T cells (g) in the lung. h, i Analysis of NP-TetposCD8+ T cells in the lung: representative FACS plots (h), total number (i), frequency and number of SLEC (j) and MPEC (k) among these NP-TetposCD8+ T cells, and SLEC/MPEC ratio (l). Mean + s.e.m. of N = 3–8 mice per group compared with t tests. *P < 0.05 and **P < 0.01
Fig. 5
Fig. 5
Spontaneous TC TFH cells are glycolytic and show an altered expression of solute transporters. a Hif1a and Mct4 gene expression was compared between total CD4+ T cells and TFH cells (CD4+CXCR5+PD-1+) from TC mice using qRT-PCR and normalized to Ppia. b Hif1α protein expression (as determined by MFI using flow cytometry) in total CD4+ T cells and TFH cells from B6 and TC mice. cd ECAR during a mitochondrial stress test conducted on TFH (CD4+CD44+PD-1hiPSGL-1lo) and CD44 CD4+ T cells from B6 and TC mice. c Time-course with the arrows indicating the addition of oligomycin (Olig), trifluoromethoxy carbonylcyanide phenylhydrazone (FCCP), and actimycin A and rotenone (Act & Rot). The horizontal gray bar indicates the three time-point measurements of basal ECAR, and the white bar indicates maximum ECAR. The TC and B6 TFH cells plots were significantly different (two-way ANOVA, P < 0.001). d Basal and max ECAR averages in B6 and TC TFH cells. e 2NDBG uptake by B6 and TC TN cells (CD4+CD44), TAct cells (CD4+CD44+), and TFH cells (CD4+CD44+PD-1hiPSGL-1lo). f Microarray heat-map and scatter plot of solute transporter genes differentially expressed between B6 and TC TFH cells. Heatmap coloring is mean centered (white), standard deviation normalized to 1 with red indicating above average expression and blue for below average expression. Dotplot coloring is based on signal intensity RMA normalized values, blue is lowest expression and red is highest expression. Selected genes are labeled and only the range 3–9 is shown on dotplot. g Expression of solute transporter genes in TFH cells was analyzed using qRT-PCR, and normalized to Hmbs. h Representative FACS plot (left) and MFI (right) of CD98 expression on TC and B6 TFH cells. All T cells were isolated from spleens from 7–8 month-old mice. Mean + s.e.m. of N = 4–7 per strain, compared with t tests (a, b, d, e, g, h), *P < 0.05, **P < 0.01, and ***P < 0.001
Fig. 6
Fig. 6
Spontaneous but not virus-specific TC TFH cells expressed lower levels of glutamine transporters. a Gene signature of spontaneous CD4+CXCR5+PD-1+ TFH cells using microarray (left) and Nanostring (right) on two independent cohorts of TC and B6 mice. b, c Slc1a5 expression was analyzed with the Nanostring panel in spontaneous TFH cells (b), as well as in influenza virus-specific NP+ TFH cells (CD4+CXCR5+PD-1+NP-Tetpos, right) versus non-specific TFH cells (CD4+CXCR5+PD-1+NP-Tet, left) (c). d Representative FACS plot (left) and MFI (right) of CD98 expression on influenza virus-specific NP-Tetpos TFH cells (CD4+CXCR5+PD-1+NP-Tetpos) and non-specific TFH cells (CD4+CXCR5+PD-1+NP-Tetneg), as well as non-TFH (CD4+CXCXR5PD1) cells. All T cells were isolated from spleens. Mean + s.e.m. of N = 3–9 mice per group compared with t tests, *P < 0.05, **P < 0.01, and ***P < 0.001
Fig. 7
Fig. 7
Glutamine metabolism is required for both induced and spontaneous antibody responses. a Experimental design for immunization with NP-KLH in alum in 8–10-week-old B6 and TC mice treated or not with glutamine antagonist DON. Frequency and cell number of TFH cells (b), and ratio of TFH to TFR cells (CD4+CXCXR5+PD1+Bcl6+FOXP3− and CD4+CXCXR5+PD1+Bcl6+FOXP3+) (c). d MFI of Bcl6, CD40L and ICOS in TFH cells. e Representative spleen sections with GCs shown in the dotted lines. The first rows show composite images and the second rows show GL7-staining only. All images are 10× amplification (scale bar: 200 μM). f, g Frequency and number of NP-specific GC B cells (f) and number of NP-specific plasma cells (g). Serum levels of high-affinity anti-NP4, low-affinity anti-NP25 IgG1, and anti-NP25 IgM NP-specific antibodies (h), and total IgG and IgM (i). All cell analyses were performed with splenocytes. Mean + s.e.m. of N = 4–12 mice per group compared with t tests, *P < 0.05, **P < 0.01, and ***P < 0.001
Fig. 8
Fig. 8
Effect of DON treatment on spontaneous GC formation. ac B6 and TC mice were treated with DON 3 times a week for 2 weeks starting at 7–8 months of age. Frequency and number of total B cells (a), GC B cells (b) and plasma cells (c). d Representative spleen sections stained with B220-PE (red), CD4-APC (purple) and GL7-FITC (green). The first rows show composite images and the second rows show GL7-staining only. GCs are shown in the dotted lines. All images are 10× amplification (scale bar: 200 μM). e, f GC (e) and follicle (f) surface area as measured by GL7+ pixels (e, left) and GL7 intensity in these areas (f, right), and by B220+ pixels in 3–5 high power fields from 2 mice per group. gi Frequency and number of total CD4+ T cells (g), TFH cells (h), and MFI of Bcl6 in TFH cells (i). j Serum anti-dsDNA IgG represented as percent change from pre-treatment value. Statistical comparisons were made between terminal samples. All cell analyses were performed with splenocytes. Mean + s.e.m. N = 6 mice per group compared with t tests, *P < 0.05, **P < 0.01, and ***P < 0.001

Comment in

References

    1. Nutt SL, Tarlinton DM. Germinal center B and follicular helper T cells: siblings, cousins or just good friends? Nat. Immunol. 2011;12:472–477. doi: 10.1038/ni.2019. - DOI - PubMed
    1. Pratama A, Vinuesa CG. Control of TFH cell numbers: why and how? Immunol. Cell Biol. 2014;92:40–48. doi: 10.1038/icb.2013.69. - DOI - PubMed
    1. Radic MZ, Weigert M. Genetic and structural evidence for antigen selection of anti-DNA antibodies. Annu. Rev. Immunol. 1994;12:487–520. doi: 10.1146/annurev.iy.12.040194.002415. - DOI - PubMed
    1. Kim SJ, Lee K, Diamond B. Follicular helper T cells in systemic lupus erythematosus. Front. Immunol. 2018;9:1793. doi: 10.3389/fimmu.2018.01793. - DOI - PMC - PubMed
    1. Daikh DI, Finck BK, Linsley PS, Hollenbaugh D, Wofsy D. Long-term inhibition of murine lupus by brief simultaneous blockade of the B7/CD28 and CD40/gp39 costimulation pathways. J. Immunol. 1997;159:3104–3108. - PubMed

Publication types