. 2018 Oct 22;9(1):4383.
doi: 10.1038/s41467-018-06318-7.

Single cell RNA sequencing of human liver reveals distinct intrahepatic macrophage populations

Affiliations

Single cell RNA sequencing of human liver reveals distinct intrahepatic macrophage populations

Sonya A MacParland et al. Nat Commun. .

Abstract

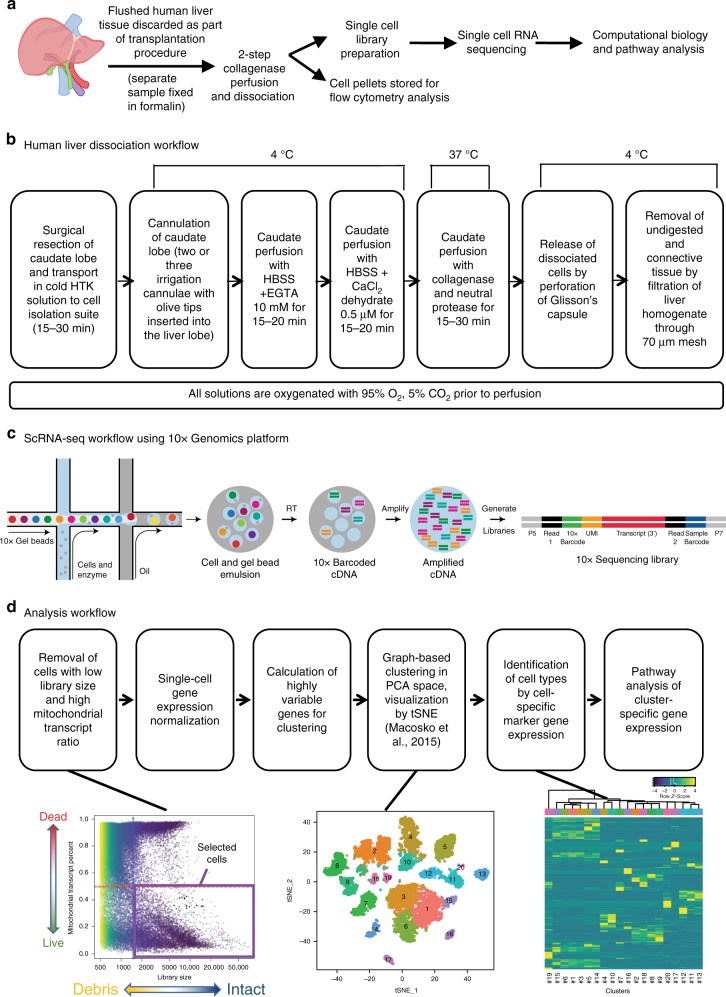
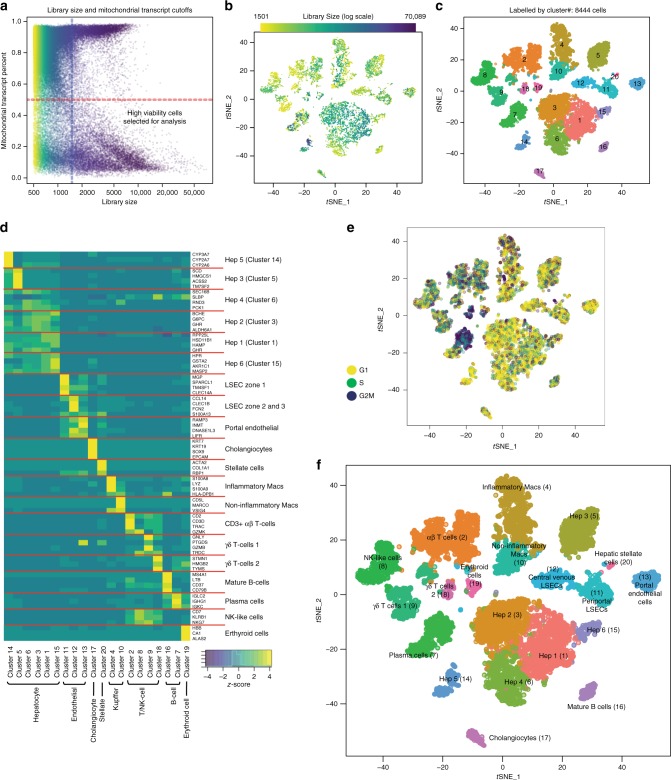
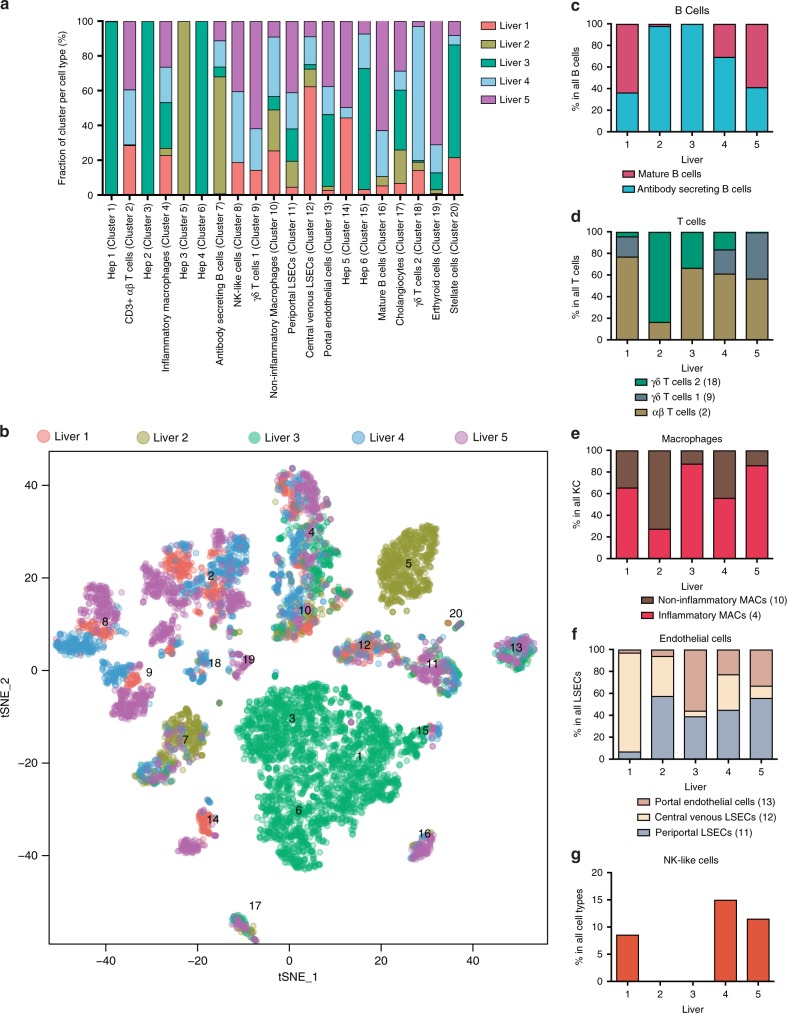
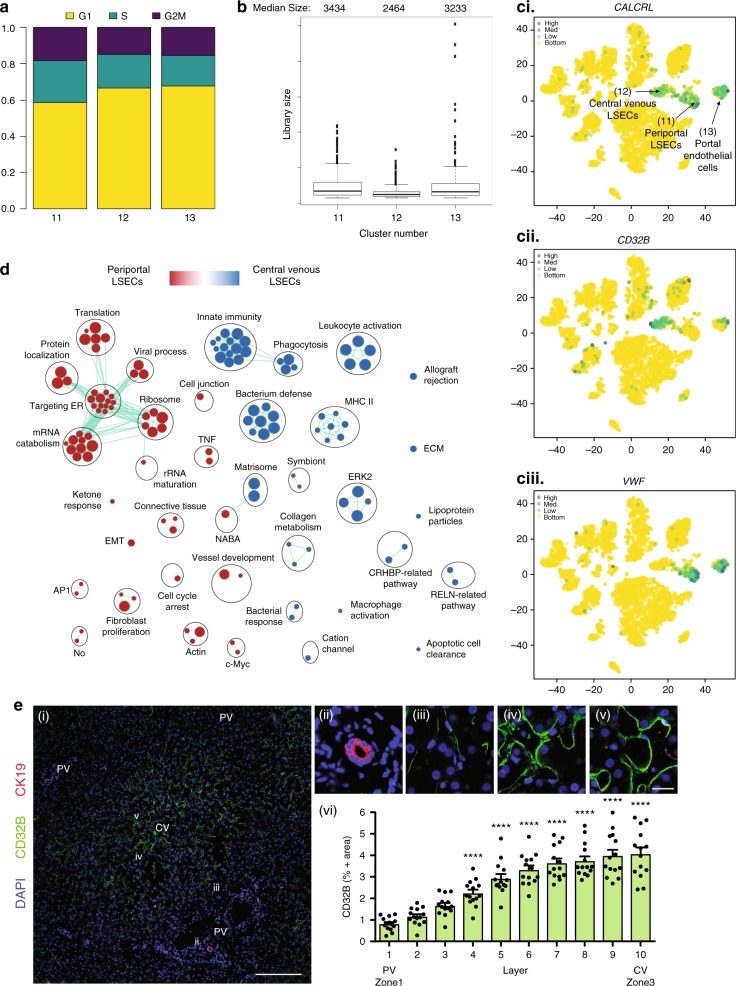
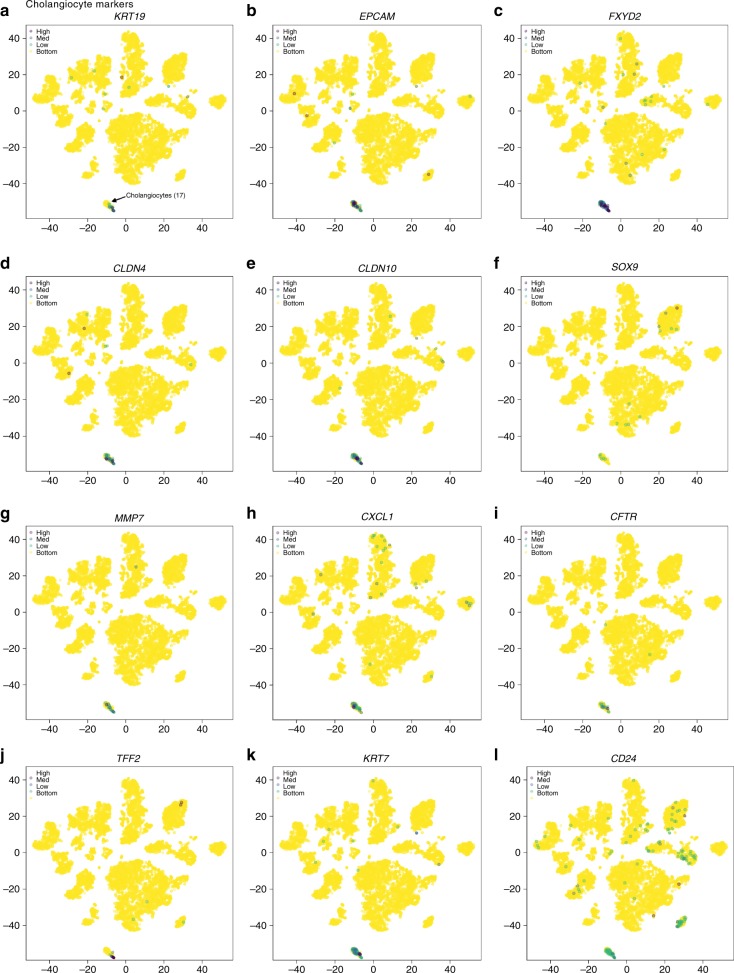
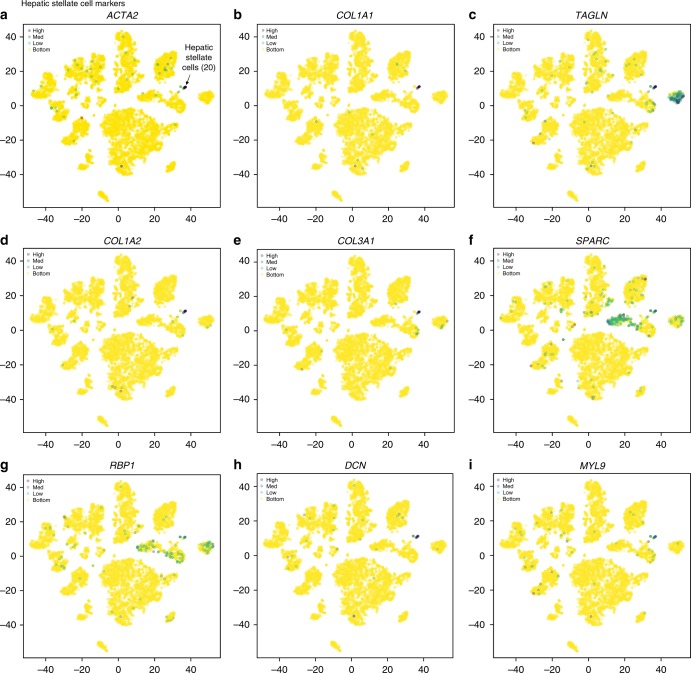
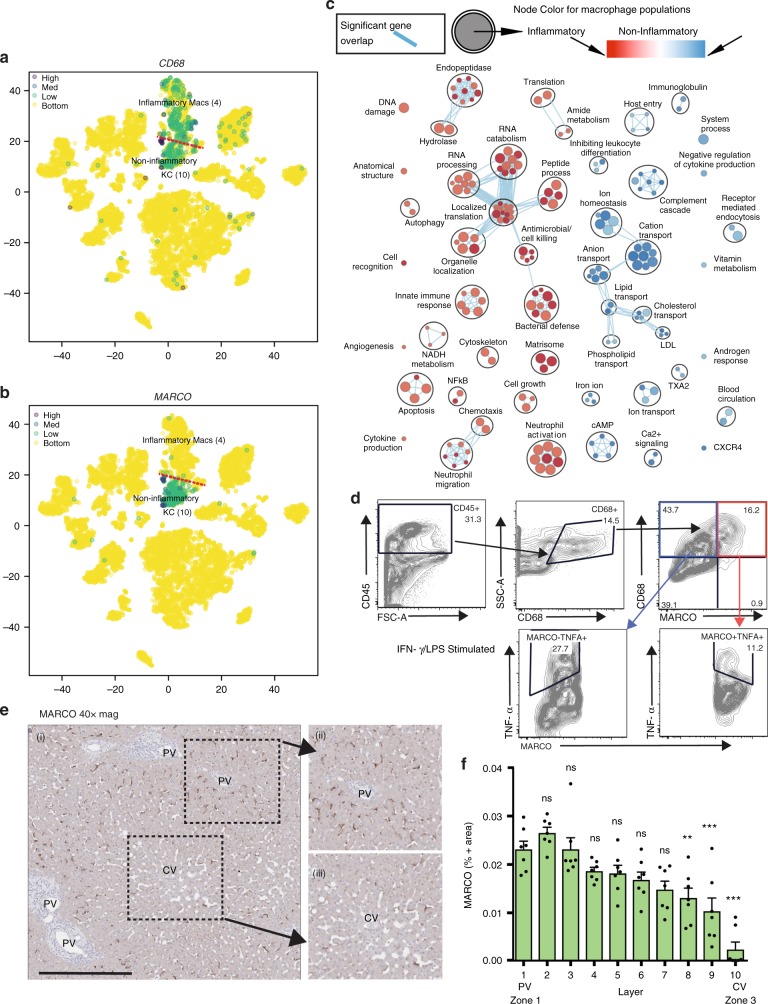
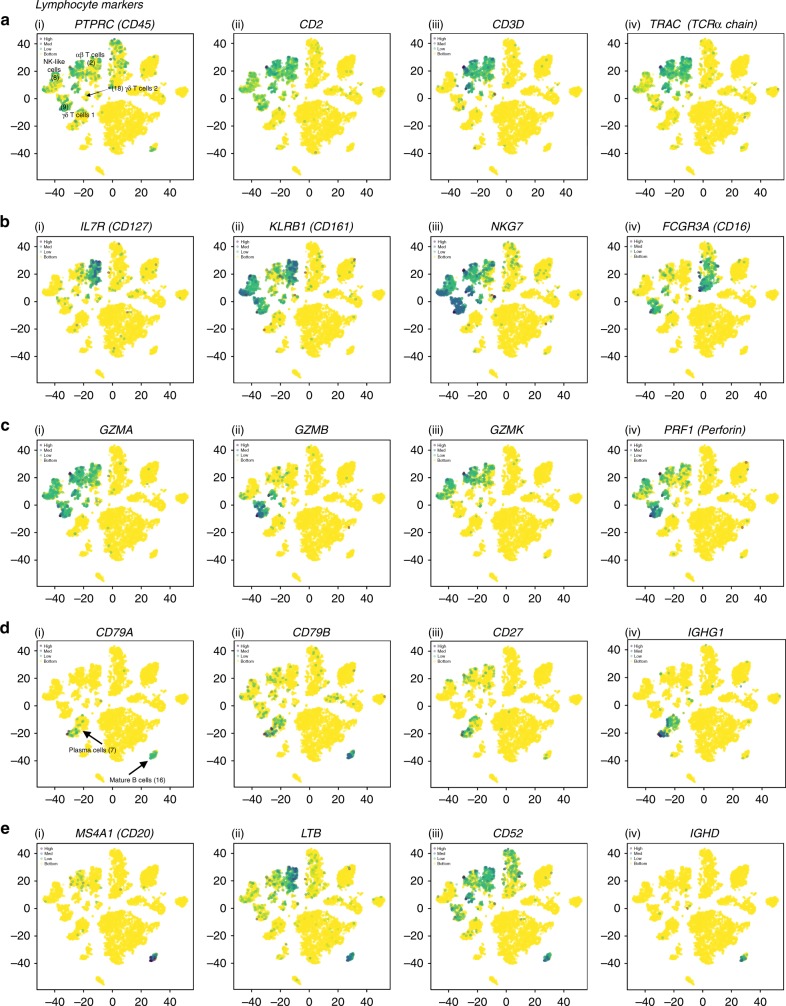
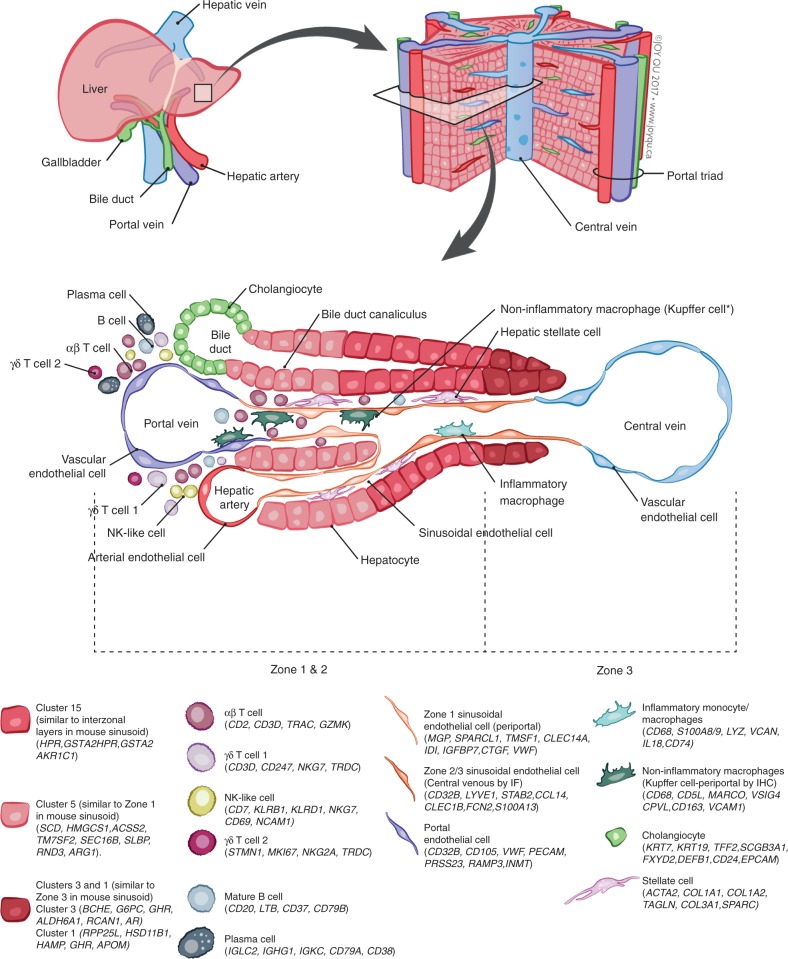
The liver is the largest solid organ in the body and is critical for metabolic and immune functions. However, little is known about the cells that make up the human liver and its immune microenvironment. Here we report a map of the cellular landscape of the human liver using single-cell RNA sequencing. We provide the transcriptional profiles of 8444 parenchymal and non-parenchymal cells obtained from the fractionation of fresh hepatic tissue from five human livers. Using gene expression patterns, flow cytometry, and immunohistochemical examinations, we identify 20 discrete cell populations of hepatocytes, endothelial cells, cholangiocytes, hepatic stellate cells, B cells, conventional and non-conventional T cells, NK-like cells, and distinct intrahepatic monocyte/macrophage populations. Together, our study presents a comprehensive view of the human liver at single-cell resolution that outlines the characteristics of resident cells in the liver, and in particular provides a map of the human hepatic immune microenvironment.


Conflict of interest statement

The authors declare no competing interests.

Figures

Fig. 1
Fig. 1
ScRNA-seq profiling of parenchymal and non-parenchymal cells from the human liver. a Overview of the single-cell isolation and analysis workflow. Workflows for b the dissociation of human caudates to single-cell homogenates, c the generation of scRNA-seq cDNA expression libraries using the 10x Genomics genomics platform and, d data analysis
Fig. 2
Fig. 2
20 distinct cell populations were revealed in healthy human livers. a Viable cells were identified from the single-cell libraries having a minimum library size of 1500 transcripts and a maximum of 50% mitochondrial transcript proportion. b t-SNE projection of 8444 liver cells (each point represents a single cell). Cells are colored by library size, with darker colors indicating larger libraries. c t-SNE projection where cells that share similar transcriptome profiles are grouped by colors representing unsupervised clustering results. d Heat map analysis using known gene expression profiles of hepatocytes/immune cells. The identity of each cluster was assigned by matching the cluster expression profile with established cell-specific marker gene expression for hepatocytes, endothelial cells, cholangiocytes, and immune cells. e Cell-cycle phase prediction showed that hepatocyte clusters were less proliferative than immune cell clusters. f Cluster map showing the assigned identity for each cluster defined in c. The cluster number of each potential cell population is indicated in parentheses. DE: differentially expressed, MACs: macrophages, PCA: principal component analysis, t-SNE: t-distributed stochastic neighbor embedding, PCs: principal components
Fig. 3
Fig. 3
Contribution of cells to each scRNA-seq cluster by sample and subpopulation analysis. a The proportion of cells that contributed to each cluster by liver sample. b t-SNE projection of all cells, colored by the source donor, and labeled with cluster number. Most cell-type associated clusters are made up of multiple donors. Hepatocyte clusters, on the other hand, appear to segregate by donor. c Proportions of mature vs. plasma B cells across five liver samples as a percentage of total B cells. Similar subpopulation analyses were carried out for d αβ & γδ T cells e Macrophages (Macs), f Endothelial cells, and g Natural killer (NK)-like cells. LSECs liver sinusoidal endothelial cells
Fig. 4
Fig. 4
ScRNA-seq analysis of hepatocyte populations. a Distribution of hepatocytes by cell-cycle phase (G1, G2/M, S) and hepatocyte cluster (1, 3, 5, 6, 14, 15). b Box plot of library size for each hepatocyte cluster with median library size (top) and graphically denoted median (dark horizontal line). Outliers (black dots) and interquartile range (black box) are indicated. c t-SNE plots showing the expression of general hepatocyte markers based on PCA clustering of 8444 cells. c (i) ALB, c (ii) HAMP, c (iii) ARG1, c (iv) PCK1, c (v) AFP, c (vi) BCHE. Legend for relative expression of each marker from lowest expression (yellow dots) to highest expression (purple dots) (top left). c (vii) t-SNE projection showing a reference map of all six hepatocyte clusters. d Pathway enrichment analysis examining active cellular pathways in clusters 1, 3, 5, 6, 14 & 15. The size of the nodes represents the number of genes in a particular pathway. Highly related pathways are grouped into a theme (black circle) and labeled in Cytoscape (Version 3.6.1). Intra- and inter-pathway relationships are shown (green lines) and represent the number of genes shared between each pathway. Periportal and pericentral zones are assigned in relation to correlation analysis between mouse and human liver in Supplementary Fig. 8. Statistical significance of the correlation between mouse liver layers and human liver clusters (denoted under each pathway analysis) calculated using Pearson correlation. ∗∗∗P < 0.001, ∗∗P < 0.01, P < 0.05. t-SNE t-distributed stochastic neighbor embedding
Fig. 5
Fig. 5
ScRNA-seq analysis of LSEC populations. a Distribution of LSECs by cell-cycle phase (G1, G2/M, S) and LSEC cluster (11, 12, 13). b Box plot of library size for each LSEC cluster with median library size (top) and graphically denoted median (dark horizontal line). Outliers (black dots) and interquartile range (black box) are indicated. c t-SNE projection of the expression of established LSEC markers in the three identified clusters. c (i) CALCRL (ii) CD32B, and c (iii) VWF. d Pairwise pathway enrichment analysis of genes DE between clusters 11 and 12 defined in Fig 2f. Pathways enriched in periportal LSECs (Cluster 11) are labeled in red and pathways enriched in central venous LSECs (Cluster 12) are indicated in blue. Colored circles (nodes) represent pathways, sized by number of genes they contain. Green lines depict intra- and inter-pathway relationships according to the number of genes shared between each pathway. Black circles group related pathways into themes that are labeled. e (i) Immunofluorescence of CD32B distribution in liver zone 1 (portal vein - PV), and 2/3 (central vein - CV). CD32B stains mainly LSEC cluster 12 and CK19 stains periportal ductal cells. e (ii, iii, iv, v) are magnified sections corresponding to the indicated roman numerals (white) in (e (i)). e (i) Scale bar represents 200 μm, e (v) scale bar represents 20 μm. Staining was performed on HIER (10 mM Citrate pH 6.0, 95 °C,15 min) treated slides visualized using the matching donkey anti-host antibody and counterstained with DAPI. Slides were scanned and lobules defined as in Supplementary Fig. 10. e (vi) Quantification of percent CD32B positive cells in liver zones 1–3. Error bars show the standard error of the mean for at least 10 replicates. Statistical significance evaluated using a one-way analysis of variance (ANOVA) with a Bonferroni post-test ∗∗∗P < 0.001, ∗∗P < 0.01, P < 0.05. t-SNE: t-distributed stochastic neighbor embedding
Fig. 6
Fig. 6
ScRNA-seq analysis of the cholangiocyte population. t-SNE plots showing relative distribution of commonly expressed cholangiocyte genes in the healthy NDD liver. Protein alias described in parentheses if different from gene name. Expression of a KRT19 (CK19), b EPCAM, c FXDY2, d CLDN4, e CLDN10, f SOX9, g MMP7, h CXCL1, i CFTR, j TFF2, k KRT7 (CK7), l CD24. Legend for relative expression of each marker from lowest expression (yellow dots) to highest expression (purple dots) (top left). t-SNE: t-distributed stochastic neighbor embedding
Fig. 7
Fig. 7
ScRNA-seq analysis of hepatic stellate cell population. t-SNE plots showing the relative distribution of commonly expressed hepatic stellate cell genes in the healthy liver. Protein alias described in parentheses if different from gene name. Expression of a ACTA2, b COL1A1, c TAGLN, d COL1A2, e COL3A1, f SPARC, g RBP1, h DCN, and i MYL9. Legend for relative expression of each marker from lowest expression (yellow dots) to highest expression (purple dots) (top left). t-SNE: t-distributed stochastic neighbor embedding
Fig. 8
Fig. 8
ScRNA-seq identifies two distinct populations of human liver resident macrophages/monocytes. a, b t-SNE projection of 8444 liver cells, with each cell colored based on expression of a CD68 and b MARCO. c Pairwise pathway enrichment analysis comparing gene expression in the two CD68+ macrophage clusters defined in Fig 2f. Pathways enriched in non-inflammatory KCs are labeled in blue and pathways enriched in inflammatory KCs are indicated in red. Colored circles (nodes) represent pathways, sized by number of genes they contain. Green lines depict intra- and inter-pathway relationships according to the number of genes shared between each pathway. Black circles group related pathways into themes that are labeled. d Flow cytometry data showing the response of monocytes/macrophages in total liver homogenate cell suspensions to stimulation with 1 μg/ml LPS and 25 ng/ml IFN-γ. Cells were stained with anti-human CD45 (clone: HI30), anti-CD68 (clone: Y1/82 A), anti-MARCO (polyclonal; Invitrogen, PA5-26888, goat anti-rabbit secondary antibody), and anti-TNF-α antibodies. Full gating strategy and controls shown in Supplementary Fig. 15. e, f Distribution of MARCO-positive cells in liver zones 1–3. Scale bar represents 500 μm. Staining was performed on 5–7 μM slices cut from formalin-fixed, paraffin-embedded resected liver tissue. Using anti-MARCO (clone: Invitrogen, PA5-26888) and anti-CD68 (clone: PG-M1) at ×40 magnification. f Quantification of percent MARCO-positive cells in liver zones 1 to 3. Error bars show the standard error of the mean for at least seven replicates. Statistical significance evaluated using a one-way analysis of variance (ANOVA) with a Bonferroni post-test ∗∗∗P < 0.001, ∗∗P < 0.01, P < 0.05
Fig. 9
Fig. 9
The distribution of commonly expressed lymphocyte genes in the healthy liver. ac i–iv t-SNE plots showing the relative distribution of common αβ T cell, γ∂ T cell, and NK cell markers. d i–iv Common markers of antibody-secreting B cells (plasma cells). e i–iv Common markers of mature B cells. Legend for relative expression of each marker from lowest expression (yellow dots) to highest expression (purple dots) (top left)
Fig. 10
Fig. 10
Summary map of the human liver. The main “building block” of the liver is the hepatic lobule, which includes a portal triad, hepatocytes aligned between a capillary network, and a central vein. The portal triad is made up of the hepatic artery, the portal vein and the bile duct. Found between the liver sinusoids are parenchymal cells (hepatocytes) and non-parenchymal cells (endothelial cells, cholangiocytes, macrophages, hepatic stellate cells, and liver infiltrating lymphocytes- including B cells, αβ and γδ, T cells, and NK cells). Non-inflammatory macrophages are labeled Kupffer cells based on their transcriptional similarity to mouse KC. The location of B cells, plasma cells, T cells, and NK cells has yet to be confirmed by immunohistochemical staining of these populations in situ so their location in this schematic is not representative of their zonated distribution. The zonation of hepatocytes was not confirmed by immunohistochemical staining and is inferred as a result of pathway analysis and transcriptional similarity to the zonated gene expression patterns previously shown in mice (Halpern et al.)

Comment in

References

    1. Robinson MW, Harmon C, O’Farrelly C. Liver immunology and its role in inflammation and homeostasis. Cell. Mol. Immunol. 2016;13:267–276. doi: 10.1038/cmi.2016.3. - DOI - PMC - PubMed
    1. Papalexi E, Satija R. Single-cell RNA sequencing to explore immune cell heterogeneity. Nat. Rev. Immunol. 2018;18:35–45. doi: 10.1038/nri.2017.76. - DOI - PubMed
    1. Villani AC, et al. Single-cell RNA-seq reveals new types of human blood dendritic cells, monocytes, and progenitors. Science. 2017;356:eaah4573. doi: 10.1126/science.aah4573. - DOI - PMC - PubMed
    1. Muraro MJ, et al. A single-cell transcriptome atlas of the human pancreas. Cell Syst. 2016;3:385–394 e383. doi: 10.1016/j.cels.2016.09.002. - DOI - PMC - PubMed
    1. Baron M, et al. A single-cell transcriptomic map of the human and mouse pancreas reveals inter- and intra-cell population structure. Cell Syst. 2016;3:346–360.e344. doi: 10.1016/j.cels.2016.08.011. - DOI - PMC - PubMed

Publication types