. 2018 Oct 22;9(1):4386.
doi: 10.1038/s41467-018-06883-x.

Long non-coding RNA-dependent mechanism to regulate heme biosynthesis and erythrocyte development

Affiliations

Long non-coding RNA-dependent mechanism to regulate heme biosynthesis and erythrocyte development

Jinhua Liu et al. Nat Commun. .

Abstract

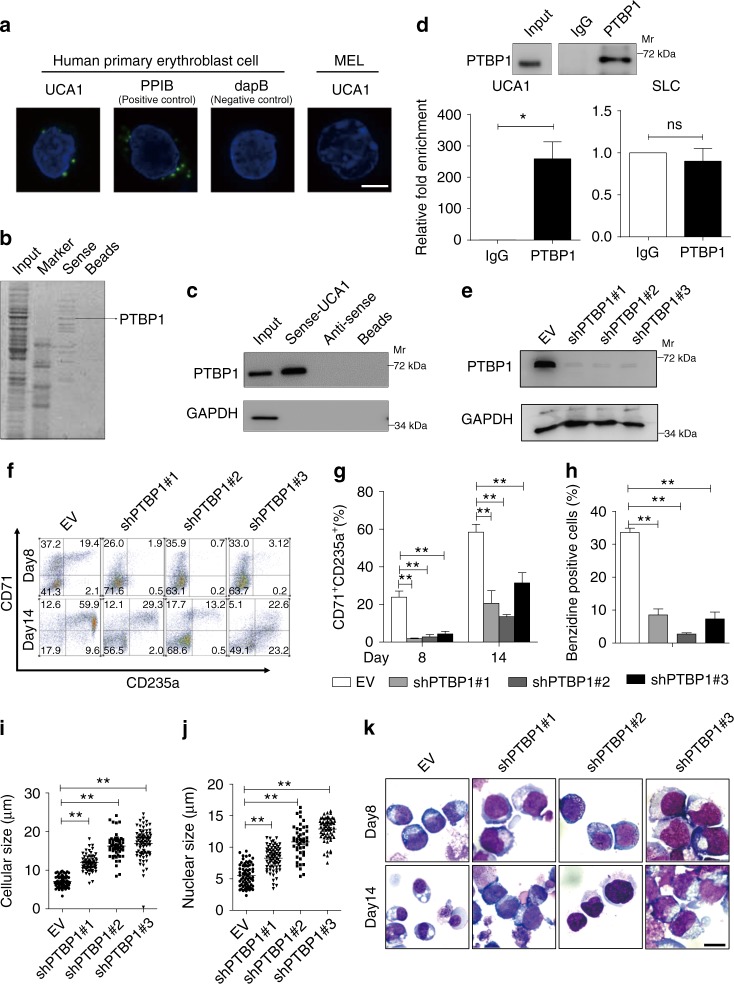
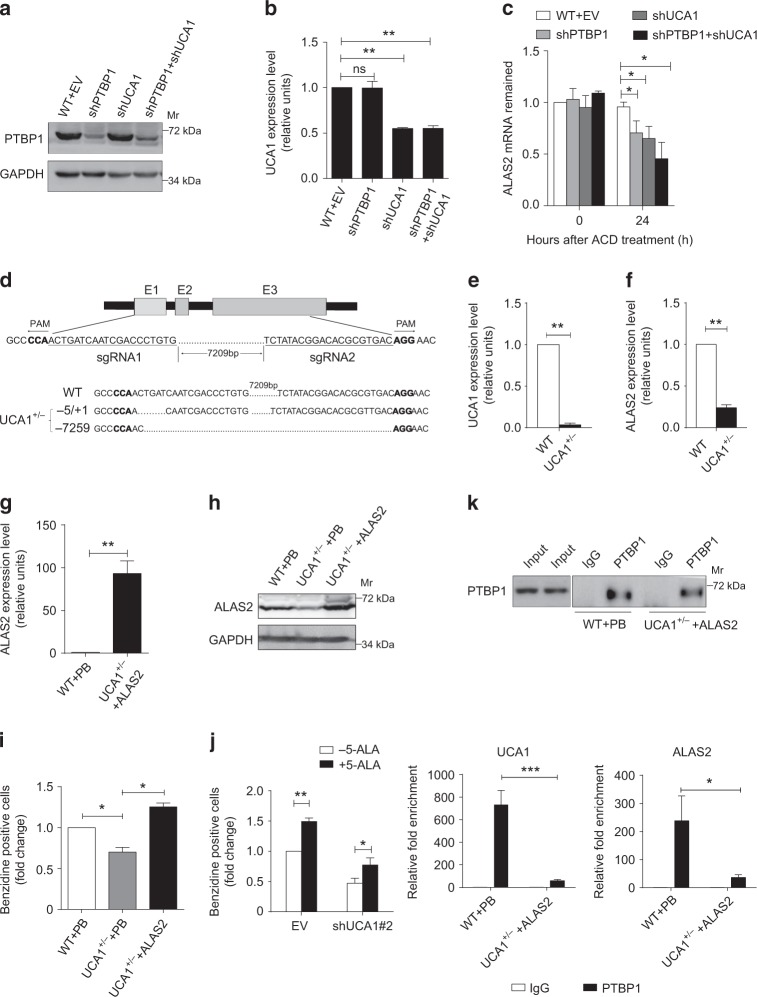
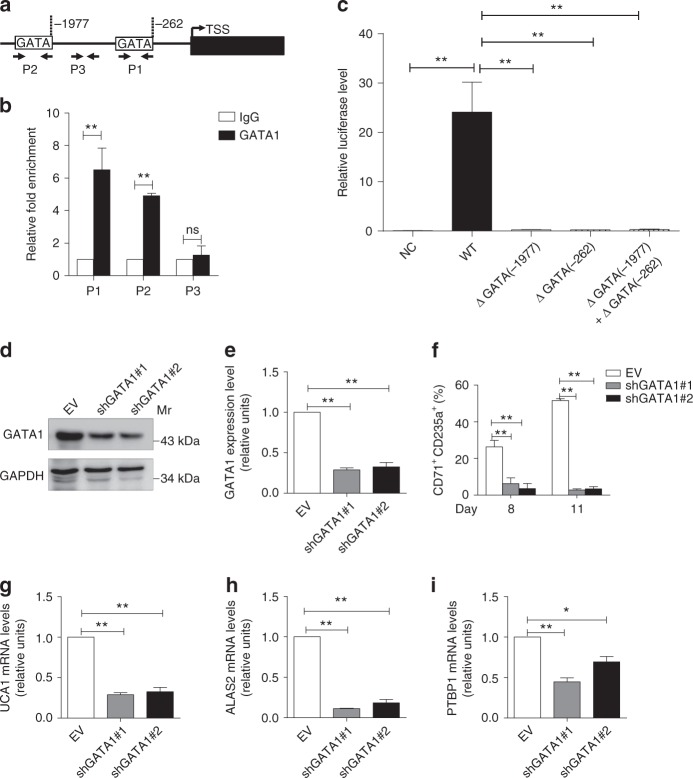
In addition to serving as a prosthetic group for enzymes and a hemoglobin structural component, heme is a crucial homeostatic regulator of erythroid cell development and function. While lncRNAs modulate diverse physiological and pathological cellular processes, their involvement in heme-dependent mechanisms is largely unexplored. In this study, we elucidated a lncRNA (UCA1)-mediated mechanism that regulates heme metabolism in human erythroid cells. We discovered that UCA1 expression is dynamically regulated during human erythroid maturation, with a maximal expression in proerythroblasts. UCA1 depletion predominantly impairs heme biosynthesis and arrests erythroid differentiation at the proerythroblast stage. Mechanistic analysis revealed that UCA1 physically interacts with the RNA-binding protein PTBP1, and UCA1 functions as an RNA scaffold to recruit PTBP1 to ALAS2 mRNA, which stabilizes ALAS2 mRNA. These results define a lncRNA-mediated posttranscriptional mechanism that provides a new dimension into how the fundamental heme biosynthetic process is regulated as a determinant of erythrocyte development.


Conflict of interest statement

The authors declare no competing interests.

Figures

Fig. 1
Fig. 1
UCA1 expression peaks in proerythroblasts during human erythropoiesis. a Primary human erythroid cells differentiated from hematopoietic cord blood progenitor CD34+ cells ex vivo were monitored by Wright-Giemsa staining on days 4, 8, 11, 14. Arrowheads denote enucleated reticulocytes. Scale bar = 10 μm. b, c Benzidine staining (b) shows the hemoglobin production at the indicated times. Scale bar = 20 μm. The bar graph (c) depicts the percentage of benzidine-positive cells. d, e Flow-cytometric analysis (d) of the expression of differentiation markers CD71 and CD235a at the indicated times. The bar graph (e) depicts the percentage of CD71+CD235a+ cells. f The relative UCA1 abundance was quantitated by qRT-PCR during primary erythroid differentiation. The level of UCA1 RNA was normalized to that of 18S rRNA. g UCA1 conservation among mammals from UCSC Genome Browser. Bar graphs were generated with data from three independent experiments (n= 3). Error bars represent SEM. P-values were determined by Student’s t-test. *P< 0.05, **P < 0.01
Fig. 2
Fig. 2
UCA1 depletion impairs heme metabolism and blocks erythroid maturation. a The relative UCA1 expression was quantitated by qRT-PCR on days 8 and 14 in shRNA or control lentivirus (EV) infected primary erythroid cells. 18S rRNA was used as the internal control. bh Human primary erythroid differentiation was monitored by flow cytometry (CD71+CD235a+ cells) (b, c), Wright-Giemsa staining (d, Scale bar = 10 μm), the cellular (e) and nuclear size (f) (on day 14, n= 100), and benzidine staining (g, h, Scale bar = 20 μm) on days 14 in shRNA lentivirus infected cells or control lentivirus (EV) infected cells. i The heatmap depicts DEGs profiling after UCA1 depletion (shRNA#2) in differentiated erythroblasts at day 8 (Padj < 0.05 and FPKM > 0.1). j Hallmark gene set enrichment analysis of DEGs after UCA1 knockdown. Bar graphs were generated with data from three independent experiments (n = 3). Error bars represent SEM. P-values were determined by Student’s t-test.*P < 0.05, **P < 0.01
Fig. 3
Fig. 3
UCA1 interacts with PTBP1 to regulate erythroid maturation. a UCA1 localization was determined by RNA-FISH in primary erythroid cells differentiated ex vivo for 8 days. Probes for PPIB act as a positive control and probes for bacterial gene dapB act as a negative control. MEL cells act as another negative control for the specificity of UCA1 probes. Scale bar = 5 μm. b Mass spectrometry identified UCA1-interacting proteins after UCA1 RNA pull-down assay using in vitro transcribed RNA in AraC-induced K562 cells. c WB using anti-PTBP1 antibody, followed by UCA1 and antisense-UCA1 pull-down in HUDEP-2 cells. GAPDH was used as a negative control. d PTBP1 RIP assay in HUDEP-2 cells. WB confirmed PTBP1 immunoprecipitation (top). The relative fold enrichment of UCA1 in comparison with IgG was determined by qRT-PCR (bottom). SLC25A21-AS1 (hereafter we called it SLC for short) is an unrelated lncRNA and acts as a negative control. e PTBP1 expression examined by WB after shRNA-mediated PTBP1 knockdown with day 8 differentiated primary erythroid cells. GAPDH was used for internal control. fk Human primary erythroid differentiation after PTBP1 depletion was assessed by flow cytometry (CD71+CD235a+ cells) (f, g), benzidine staining (percentage of positive cells) (h), the cellular and nuclear size (i, j) (on day 14, n = 50) and Wright-Giemsa staining (k, Scale bar = 10 μm) after 8 and 14 days induction. Bar graphs were generated with data from three independent experiments (n= 3). Error bars represent SEM. P-values were determined by Student’s t-test. *P< 0.05, **P< 0.01
Fig. 4
Fig. 4
Linking UCA1 and PTBP1-regulated erythroid maturation to the control of heme biosynthesis. a The heatmap depicts the fold-change in DEGs after UCA1 (shRNA#2/EV) or PTBP1 depletion (shRNA#1/EV) in differentiated erythroblasts at day 8. b Hallmark enrichment analysis of the common DEGs. c GSEA showed heme metabolism gene set enrichment from the common DEGs after UCA1 (left) or PTBP1 (right) depletion. Normalized enrichment scores (NES) and P-values are indicated in each plot. d Heatmap shows the expression of heme metabolism related genes after UCA1 or PTBP1 downregulation. e GO analysis of the common heme metabolism related genes after UCA1 or PTBP1 depletion. f, g qRT-PCR to analyze the expression of genes involved in heme biosynthesis on days 8 in differentiated primary erythroid cells after UCA1 (f) or PTBP1 (g) depletion. GAPDH mRNA was used as an internal control. Bar graphs were generated with data from three independent experiments (n= 3). Error bars represent SEM. P-values were determined by Student’s t-test. *P< 0.05, **P< 0.01
Fig. 5
Fig. 5
PTBP1 protein, UCA1 RNA, and ALAS2 mRNA form a protein–RNA complex. a PTBP1 RIP assay to analyze interactions between PTBP1 and heme biosynthesis-related genes in HUDEP-2 cells. WB shows PTBP1 immunoprecipitation (top). The relative fold enrichment of heme biosynthesis-related mRNAs compared to IgG was determined by qRT-PCR (bottom). SLC was used as a negative control. b, c The enrichment of UCA1 (b) and heme biosynthetic mRNAs detected by in vivo RNA–RNA pull-down assay using UCA1-specific probes and a random probe in HUDEP-2 cells. SLC was used as a negative control. de The enrichment of ALAS2 mRNA (d), UCA1 (e) and SLC (f) by the in vivo RNA–RNA pull-down assay using ALAS2-specific probes in HUDEP-2 cells. SLC was used as a negative control. g WB using anti-PTBP1 antibody followed by in vitro transcribed ALAS2 and antisense-ALAS2 mRNA pull-down assay in HUDEP-2 cells. GAPDH was used as a negative control. hk In vitro transcribed full-length or fragmental ALAS2 mRNA pull-down assays followed by PTBP1 immunoblotting in AraC-induced K562 cells (i, j) and HUDEP-2 cells (k). We have in vitro transcribed full-length ALAS2, from 5ʹ F1 (1–1394 nt), F2 (1–850 nt), F3 (1100–1760 nt), F4 (850–1594 nt), F4 fragment with PTBP1-binding motif deletion (F4(∆CUCC)) and full-length antisense-ALAS2 mRNA. GAPDH was used as a negative control. l, m WB shows ALAS2 expression after UCA1 (l) and PTBP1 (m) depletion in primary erythroid cells differentiated for 8 days. GAPDH was used as a loading control. n = 3 independent experiments. Error bars represent SEM. P-values were determined by Student’s t-test. *P < 0.05, **P < 0.01
Fig. 6
Fig. 6
UCA1 is indispensable for PTBP1 regulation of ALAS2 mRNA stability. ac ALAS2 mRNA stability assessment. K562 cells were infected with lentiviral control vector (EV), shUCA1, shPTBP1, and shUCA1 + shPTBP1 after induced by AraC for 24 h. The cells were treated with Actinomycin D (5 μg per ml) for 24 h to quantitate ALAS2 mRNA stability. The expression of PTBP1 and UCA1 was quantitated by WB (a) and qRT-PCR (b), respectively. The ALAS2 mRNA abundance, relative to GAPDH, was quantified by qRT-PCR (c). d Schematic illustrating UCA1 deletion using CRISPR/Cas9 technology in K562 cells (top). UCA1 compound heterozygous mutant cell line (UCA1+/-) was confirmed by DNA sequencing (bottom). e, f The relative abundance of UCA1 (e) and ALAS2 (f) mRNA was quantified by qRT-PCR in WT and UCA1+/- cells, respectively. g, h The overexpression of ALAS2 mRNA (g) and protein (h) was measure by qRT-PCR and WB, respectively. ALAS2 piggybac transposon expression vector or the empty piggybac vector (PB) were transfected to WT or UCA1+/- K562 cells. GAPDH mRNA and protein was used for internal control for qRT-PCR and WB, respectively. i The relative fold-change of benzidine-positive cells (%) in UCA1+/- cells with ALAS2 overexpression (UCA1+/- + ALAS2) and UCA1+/- cells with empty piggybac expression vector (UCA1+/- + PB) to that of WT K562 cells transfected with empty vector (WT + PB). j The relative fold-change of benzidine-positive cells (%) at day 14 differentiated primary erythroid cells. The cells were first infected with lentiviral control vector (EV) or UCA1 shRNA#2 at day 4 and then 300 μM 5-ALA was supplemented to the culture medium at day 6. k PTBP1 RIP assay was conducted to test for interaction between PTBP1 and ALAS2 mRNA. WB analysis of PTBP1 immunoprecipitation in WT or UCA1+/- cells with ALAS2 overexpression (top). The enrichment of UCA1 RNA and ALAS2 mRNA in PTBP1 immunoprecipitates was detected by qRT-PCR in WT and UCA1+/- cells, respectively, (bottom). n = 3 independent experiments. Error bars represent SEM. P-values were determined by Student’s t-test. *P< 0.05. **P< 0.01, ***P < 0.001
Fig. 7
Fig. 7
GATA1 regulates UCA1 expression during erythroid maturation. a Schematic representation of GATA motifs in the UCA1 promoter from -2 kb to the transcription start site (TSS). The white boxes depict GATA motifs, resided in the UCA1 proximal promoter at -262 and -1977 nt 5ʹ to TSS. P1, P2, and P3 are the primer sets used for ChIP-qPCR assay. b ChIP-qPCR assay analyzed GATA1 occupancy at the UCA1 promoter in primary erythroid cells after 8 days of differentiation. P3 was used as a negative control. c Luciferase report assay demonstrating GATA1 regulates UCA1 promoter transcription in a transient transfection assay. The relative luciferase activity was examined after transfection of empty pGL3 luciferase vector (NC), pGL3 containing the wild-type UCA1 promoter (WT), and pGL3 containing UCA1 promoter with different mutated GATA-binding site(s) (ΔGATA(-1977), ΔGATA(-262), ΔGATA(-1977) + ΔGATA(-262)) in AraC-induced K562 cells. d, e qRT-PCR (d) and immunoblotting (e) and analysis of GATA1 expression at day 8 in differentiated primary erythroid cells with or without GATA1 depletion. GAPDH and 18S rRNA were used as controls for WB and qRT-PCR, respectively. f The percentage of CD71+CD235a+ cells evaluated by flow-cytometric analysis on days 8 and 11 differentiated primary erythroid cells with or without GATA1 downregulation. gi qRT-PCR analysis of the relative abundance of UCA1 (g), ALAS2 (h), and PTBP1 (i) mRNA in differentiated primary erythroid cells at day 8 with or without GATA1 depletion. n= 3 independent experiments. Error bars represent SEM. P-values were determined by Student’s t-test. *P < 0.05, **P < 0.01

References

    1. Chung J, Chen C, Paw BH. Heme metabolism and erythropoiesis. Curr. Opin. Hematol. 2012;19:156–162. doi: 10.1097/MOH.0b013e328351c48b. - DOI - PMC - PubMed
    1. Yuan X, Fleming MD, Hamza I. Heme transport and erythropoiesis. Curr. Opin. Chem. Biol. 2013;17:204–211. doi: 10.1016/j.cbpa.2013.01.010. - DOI - PMC - PubMed
    1. Ishikawa H, et al. Involvement of heme regulatory motif in heme-mediated ubiquitination and degradation of IRP2. Mol. Cell. 2005;19:171–181. doi: 10.1016/j.molcel.2005.05.027. - DOI - PubMed
    1. Chiabrando D, Mercurio S, Tolosano E. Heme and erythropoieis: more than a structural role. Haematologica. 2014;99:973–983. doi: 10.3324/haematol.2013.091991. - DOI - PMC - PubMed
    1. Tanimura N, et al. Mechanism governing heme synthesis reveals a GATA factor/heme circuit that controls differentiation. EMBO Rep. 2016;17:249–265. doi: 10.15252/embr.201541465. - DOI - PMC - PubMed

Publication types

MeSH terms