. 2019 Aug;26(8):1467-1484.
doi: 10.1038/s41418-018-0221-5. Epub 2018 Oct 22.

Recruitment of LC3 to damaged Golgi apparatus

Affiliations

Recruitment of LC3 to damaged Golgi apparatus

Lígia C Gomes-da-Silva et al. Cell Death Differ. 2019 Aug.

Abstract

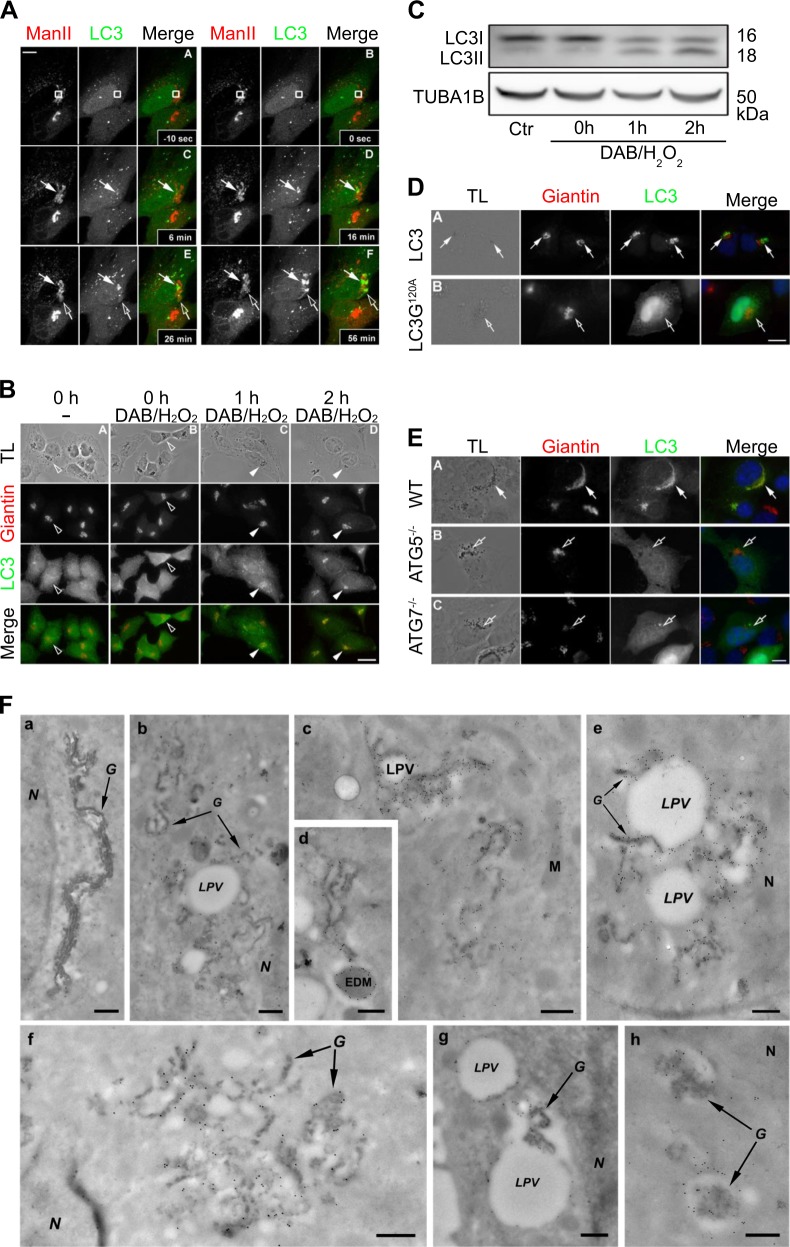
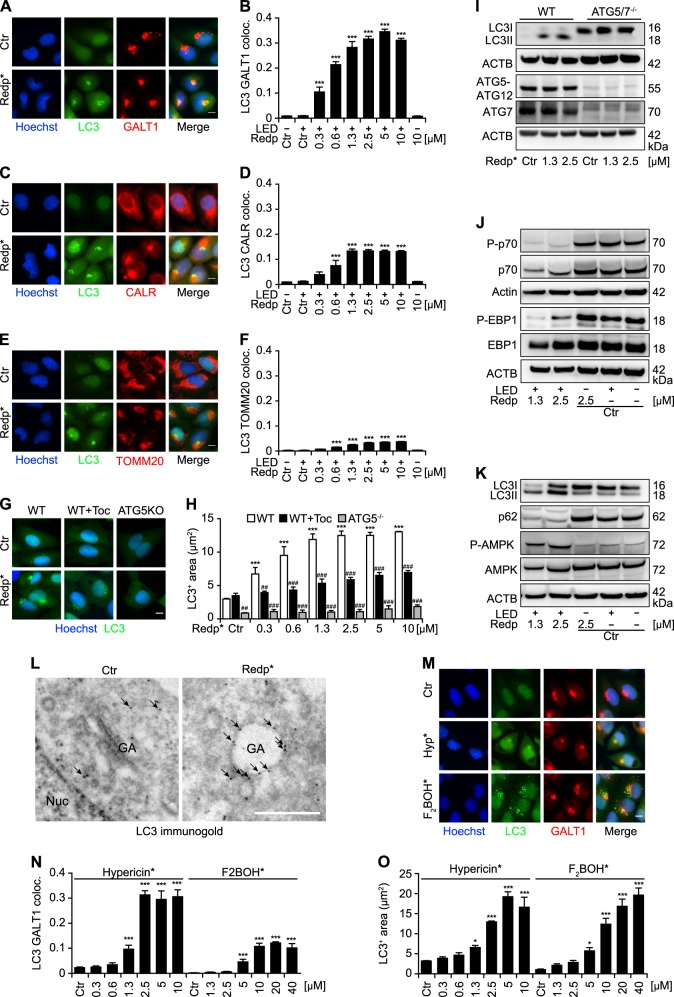
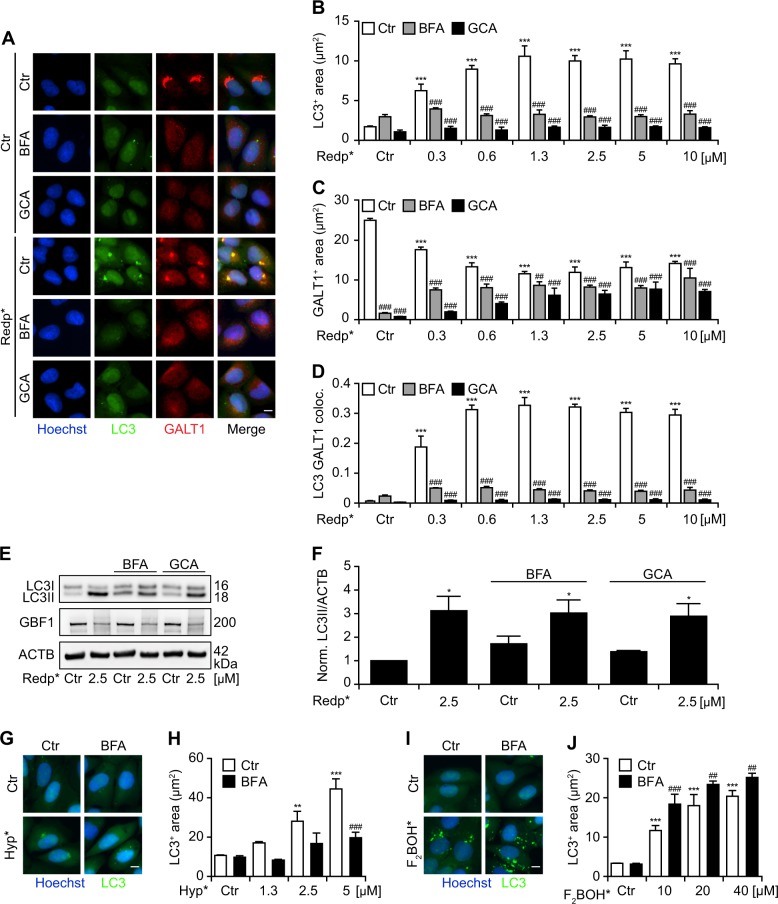
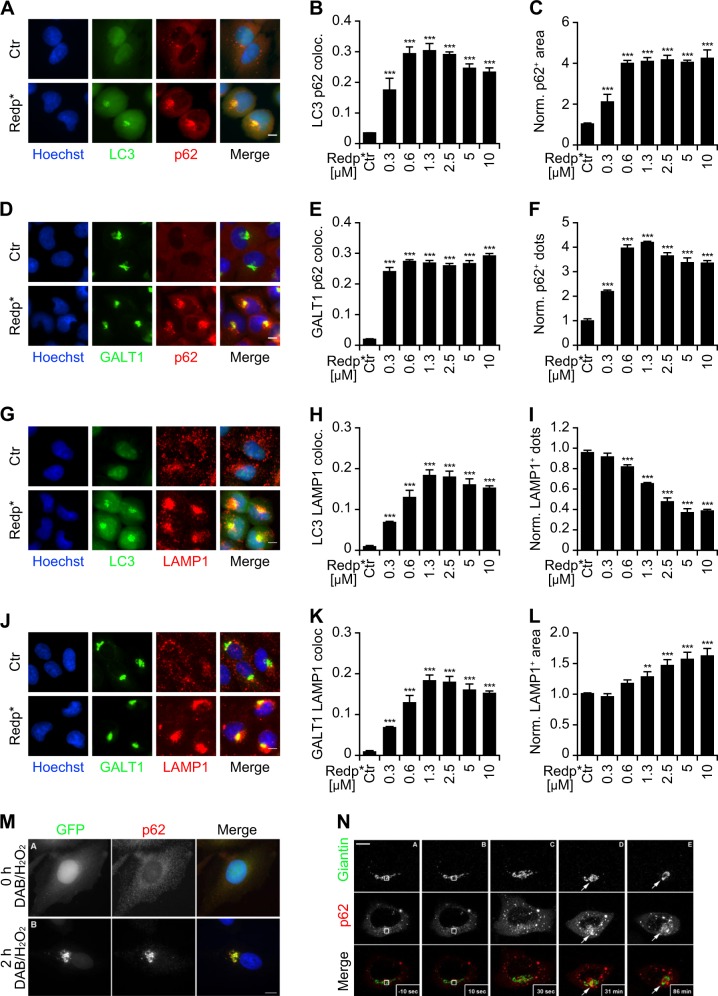
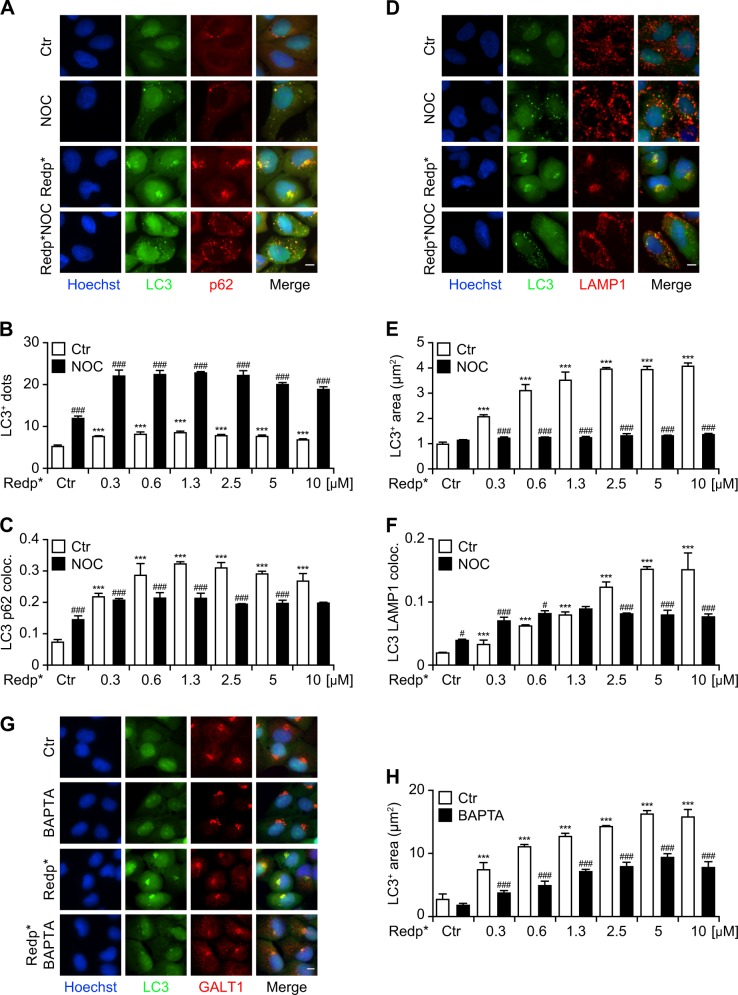
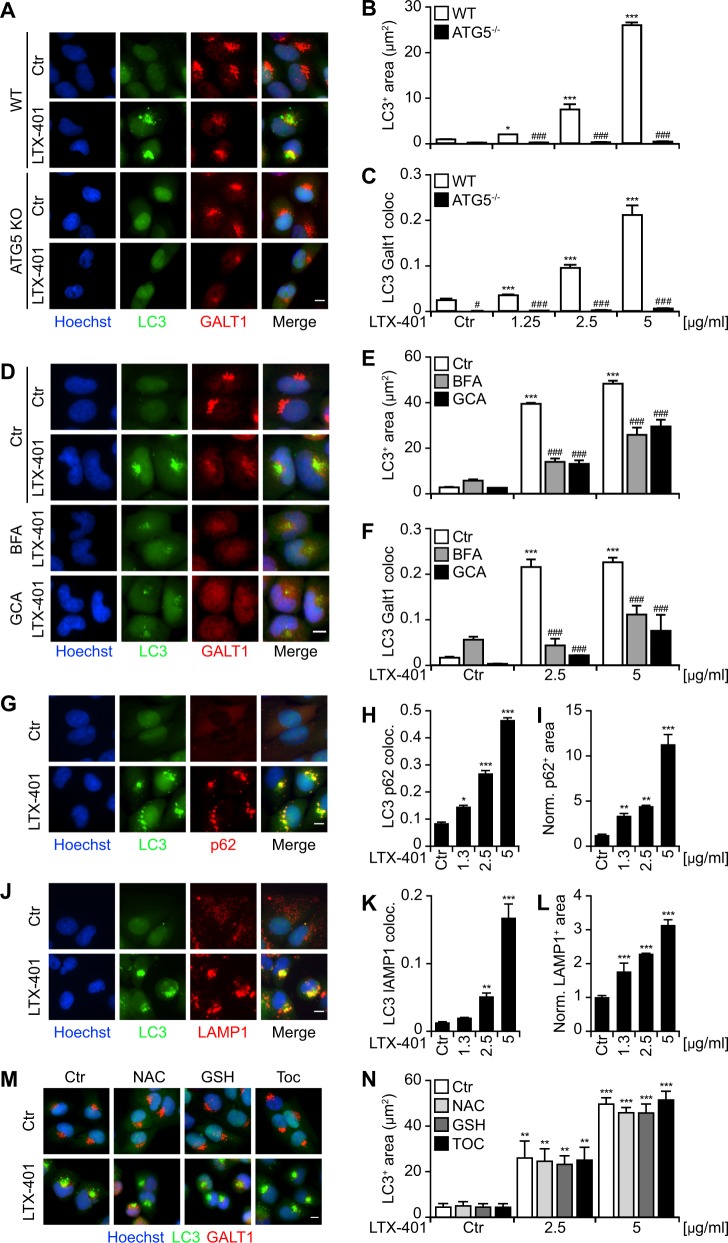
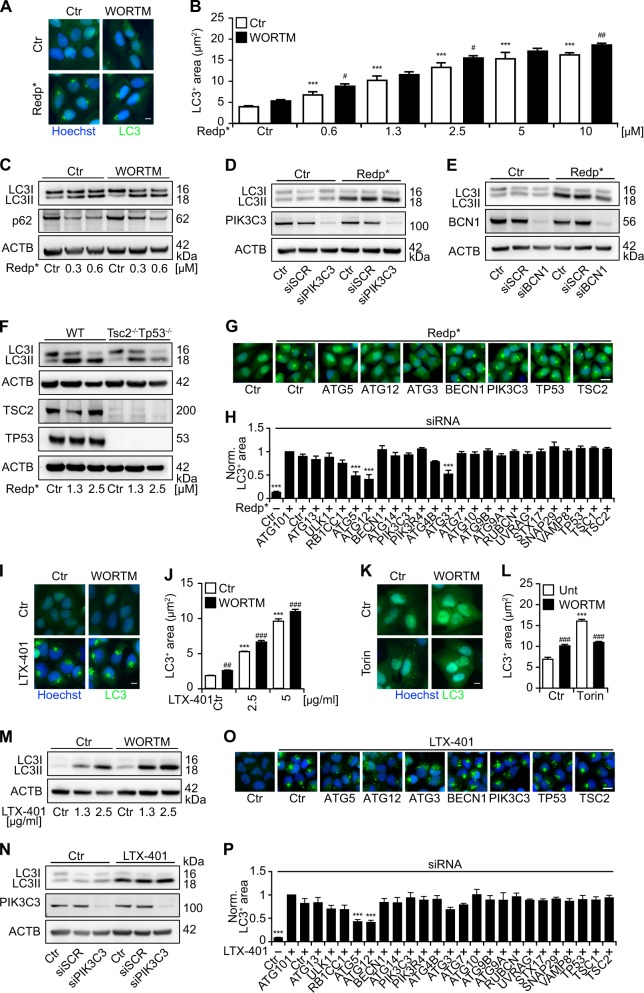
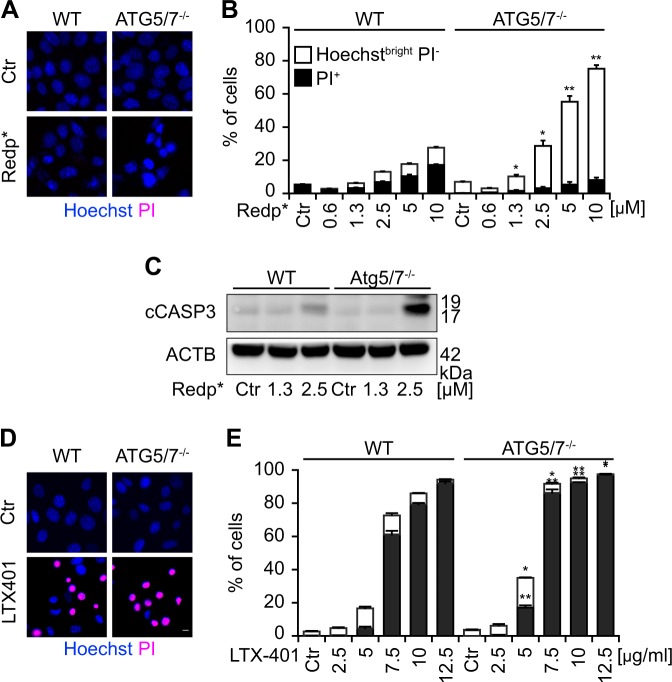
LC3 is a protein that can associate with autophagosomes, autolysosomes, and phagosomes. Here, we show that LC3 can also redistribute toward the damaged Golgi apparatus where it clusters with SQSTM1/p62 and lysosomes. This organelle-specific relocation, which did not involve the generation of double-membraned autophagosomes, could be observed after Golgi damage was induced by various strategies, namely (i) laser-induced localized cellular damage, (ii) local expression of peroxidase and exposure to peroxide and diaminobenzidine, (iii) treatment with the Golgi-tropic photosensitizer redaporfin and light, (iv) or exposure to the Golgi-tropic anticancer peptidomimetic LTX-401. Mechanistic exploration led to the conclusion that both reactive oxygen species-dependent and -independent Golgi damage induces a similar phenotype that depended on ATG5 yet did not depend on phosphatidylinositol-3-kinase catalytic subunit type 3 and Beclin-1. Interestingly, knockout of ATG5 sensitized cells to Golgi damage-induced cell death, suggesting that the pathway culminating in the relocation of LC3 to the damaged Golgi may have a cytoprotective function.


Figures

Fig. 1
Fig. 1
LC3 recruitment to wounded or intoxicated Golgi apparatus (GA). a Human cervix carcinoma HeLa cells stably transduced with GFP-LC3 (LC3) were transfected with pManII-mCherry (ManII). Photodamage was applied on a confocal microscope equipped with a 2-Photon Laser. Pictures show cells 10 seconds before photodamage A, after photodamage with the rectangle indicating the photodamaged zone B and representative images of cells at several time points after photodamage CF. White arrows follow the photodamaged zone showing early LC3 recruitment. Empty arrows indicate appearance of late LC3 recruitment elsewhere in the GA. B HeLa cells stably co-expressing ManII-HRP and GFP-LC3 were fixed directly A or were treated with DAB-H2O2 mix for 30 min at 4 °C then either fixed B or incubated in fresh complete medium for 1 or 2 h before fixation C, D. Cells were subsequently immunostained with anti-Giantin antibodies (Giantin). White arrowheads indicated recruitment of LC3 to the damaged GA. Empty arrowheads indicate absence of LC3 in the Golgi apparatus surroundings. Transmitted light (TL) images were taken to detect the DAB precipitates. Scale bars equal 10 μm. c HeLa ManII-HRP cells without prior treatment or upon treatment with DAB-H2O2 mix for 30 min at 4 °C then were either lysed directly or incubated in fresh complete medium for different time points prior to lysis. Lysates were separated by SDS-PAGE, and then electrotransferred onto a nitrocellulose membrane for immunodetection with anti-LC3 and anti-tubulin antibodies. d HeLa cells expressing ManII-HRP were transiently transfected with GFP-LC3 wt a or GFP-LC3 G120A mutant plasmids b. Cells were treated with DAB-H2O2, fixed 2 h after wash-out, and immunostained with anti-Giantin antibodies. e Wildtype, ATG5−/− or ATG7−/− mouse embryonic fibroblasts (MEFs) were co-transfected with pManII-HRP and pEGFP-LC3 wt plasmids 24 h before the experiment. Cells were treated with DAB-H2O2, fixed 2 h after wash-out and stained with anti-Giantin antibodies. White arrows indicate colocalization of LC3 with Giantin and DAB precipitate. Empty arrows indicate absence of LC3 at the GA surrounding. Transmitted light (TL) images were taken to detect the DAB precipitates. Scale bars equal 10 μm. f HeLa ManII-HRP GFP-LC3 were treated with DAB-H2O2 for 30 min at 4 °C then incubated in fresh complete medium for 0, 2, or 4 h before processing for immuno-EM. GFP-LC3 was detected using antibodies against the GFP tag and secondary antibodies labeled with 10 nm gold particles. Representative images are depicted for 0 a, 2 bd, and 4 h after DAB-H2O2 treatment eh. LPV = LC3-positive vacuoles; G = Golgi; N = nucleus; M = mitochondria. Scale bars equal 300 nm
Fig. 2
Fig. 2
Redaporfin-PDT (redp*) induces LC3 aggregation at the Golgi apparatus (GA) and the mTOR-dependent autophagic pathway. af Representative images of LC3 aggregation (GFP-LC3+) and its colocalization with GA; ER; or mitochondria are shown in a, b; c, d; and e, f, respectively. Human osteosarcoma U2OS cells stably expressing GFP-LC3 were incubated with redaporfin (redp), at the indicated concentrations, for 20 h followed by irradiation (*) at 750 nm. Six hours later, immunostaining was performed for the GA marker GALT1 a, the ER marker calreticulin c, CALR, and the mitochondrial marker Tomm20 e. Data are presented as means ± SD of triplicates of one representative experiment out of two repeats. (One-way ANOVA, ***p < 0.001 versus untreated cells). Size bar equals 10 µm. g, h Representative images of LC3 aggregation in the presence of the antioxidant tocopherol (Toc) or in ATG5 KO cells. Quantitative analysis represents the average area of GFP-LC3 puncta/cell (µm2). U2OS WT and ATG5−/− cells stably expressing GFP-LC3 were incubated with redp as mentioned above. Toc (500 µM) was added to U2OS cells stably expressing GFP-LC3 4 h before irradiation and cells were fixed 6 h post irradiation. Data are presented as means ± SD of triplicates of one representative experiment out of 2–4 repeats. (Two-way ANOVA, ***p < 0.001 versus untreated cells; ##p < 0.01, ###p < 0.001 versus the presence of Toc or absence of ATG5). Size bar equals 10 µm. ik Activation of the mTOR signaling pathway and involvement of ATG5/7 proteins in the LC3 lipidation induced by redaporfin-photodynamic therapy (PDT). Mouse embryonic fibroblasts (MEFs) WT or ATG5−/− i, and human osteosarcoma U2OS WT cells  (j, k) cells were treated with redp*. Six hours post irradiation, proteins were collected and analyzed by immunoblotting for LC3 lipidation, p62 degradation, AMPK, p70, and EBP1 phosphorylation. Representative immunoblots are depicted. l Representative images of transmission electron microscopy showing vacuolization and LC3 accumulation at the GA upon redp*. Six hours after photoactivation of redp (2.5 µM) in U2OS cells expressing GFP-LC3, GFP-LC3 was detected by immunogold and analyzed by transmission electron microcopy. mo Hypericin-PDT induces LC3 recruitment into the GA in contrast to F2BOH-mediated PDT. U2OS cells stably expressing GFP-LC3 were incubated with hypericin or F2BOH, at the indicated concentrations, for 20 h, followed by irradiation (*) and immunostaining for GALT1 at 6 h post irradiation. Representative images are shown in m, the average area of GFP-LC3+ dots per cell and the colocalization between GFP-LC3+ dots and GALT1+ structures are shown in n, o. Data indicate means ± SD of triplicates of one representative experiment out of 2–4 repeats. (one-way ANOVA, *p < 0.05,  ***p < 0.001 versus untreated cells). Size bar equals 10 µm
Fig. 3
Fig. 3
Requirement of the Golgi apparatus (GA) structure for the aggregation of LC3 in response to Redaporfin-PDT (redp*). ad Impact of Brefeldin A (BFA) and golgicide (GCA) on the LC3 aggregation and its colocalization with the GA marker, GALT1. Human osteosarcoma U2OS cells expressing GFP-LC3 were incubated with Redp, at the indicated concentrations, for 20 h followed by addition of BFA (5 µg/mL) or GCA (5 µM). Four hours later, cells were irradiated (*) and immunostaining was performed 6 h post irradiation for the GA marker, GALT1. Representative images are shown in a and the quantitative analysis that reflects the average area of GFP-LC3+ dots and GALT1+ Golgi structures per cell are shown in b and c. The level of colocalization (co-ocurrence) between GFP-LC3 dots and GALT1+ structures is depicted in d. (Two-way ANOVA, ***p < 0.001 versus untreated cells; ###p < 0.001 versus the presence of BFA or GCA). Size bar equals 10 µm. e, f Representative immunoblot and densitometry (means ± SEM of three independent experiments) for LC3 lipidation in U2OS cells submitted to redp* in the presence of BFA or GCA. gj Impact of BFA on the LC3 aggregation triggered by hypericin or F2BOH-mediated PDT. U2OS cells stably expressing GFP-LC3 were incubated with hypericin or F2BOH, at the indicated concentrations for 20 h followed by addition of BFA (5 µg/mL). Four hours later, cells were irradiated and at 6 h post irradiation, cells were fixed with PFA and the nuclei were counterstained with Hoechst 33342. Representative images and the quantitative analysis that reflects the average area of GFP-LC3+ dots are shown for hypericin in g, h and for F2BOH in i, j. (Two-way ANOVA, **p < 0.01, ***p < 0.001 versus untreated cells; ##p < 0.01, ###p < 0.001 versus the presence of BFA or GCA). Size bar equals 10 µm
Fig. 4
Fig. 4
Clustering of LC3, Golgi apparatus (GA), lysosomes and p62 after Redaporfin-PDT (redp*) and DAB-H2O2 treatments. af Recruitment of p62 at the GA after redp*. Human osteosarcoma U2OS cells expressing GFP-LC3 or the GA marker GALT1-GFP were submitted to Redp-PDT. Six hours later, cells were immunostained for p62. Representative images of p62 aggregation at sites of LC3 aggregation and at GA structures are shown in a and d, respectively, alongside with the level of colocalization in b and e. The average number and area of p62+ structures (normalized to untreated controls) are depicted in c and f. Bars indicate means ± SD of triplicates of one representative experiment out of two repeats. (One-way ANOVA, ***p < 0.001 versus untreated cells). Size bar equals 10 µm. gl Recruitment of lysosomes at GA after redp*. U2OS cell expressing GFP-LC3 or the GA marker GALT1-GFP were submitted to redaporfin-PDT. Six hours later, cells were immunostained for LAMP1. Representative images of LAMP1 aggregation at sites of LC3 aggregation and at GA structures are shown in g and j alongside with the level of colocalization in h and k. The average number and area of LAMP1+ structures (normalized to untreated controls) are depicted in i and l. Data indicate means ± SD of triplicates of one representative experiment out of two repeats. (One-way ANOVA, **p < 0.1, ***p < 0.001 versus untreated cells). Size bar equals 10 µm. m, n Human cervix carcinoma HeLa cells co-expressing the Golgi-targeted peroxidase ManII-HRP and GFP-LC3 cells were treated with DAB-H2O2 then either fixed or incubated in fresh complete medium for 2 h before fixation. Cells were then immunostained with anti-p62 antibody and analyzed by fluorescence microscopy m. HeLa cells expressing both GFP-Giantin and mCherry-p62 were subjected to Golgi-targeted photodamage performed by 10 seconds of irradiation with a confocal microscope equipped with a 2-photon laser. Representative images are depicted for 10 sec before photodamage A, 10 sec, B 30 sec, C 31 min D, and 86 min E after photodamage. White box indicates the photodamaged zone. White arrows show p62 recruitment to the photodamaged Golgi apparatus. Scale bar equals 10 µm
Fig. 5
Fig. 5
The clustering of LC3, Golgi apparatus (GA), lysosomes, and p62 is dependent on microtubule dynamics. a–f Impact of nocodazole (Noc) on the formation of the LC3, p62, and lysosome clustering after redaporfin-PDT. Human osteosarcoma U2OS cells expressing GFP-LC3 were incubated with redaporfin (Redp), at the indicated concentrations, for 20 h, followed by addition of Noc (2.5 µM). Two hours later, cells were irradiated (*) and immunostaining was performed, 6 h post irradiation, for p62 a or LAMP1 proteins d. Representative images are shown in a for p62 and in d for LAMP1. The quantitative analysis that reflects the number and average area of GFP-LC3+ dots is shown in b, e and the colocalization between GFP-LC3+ puncta and p62+ or LAMP1+ structures is shown in c, f. U2OS cell expressing GFP-LC3 were submitted to redaporfin-PDT in the presence or the absence of the intracellular calcium chelator BAPTA-AM. Following cells were immunostained for GALT1. Representative images of LC3 aggregation at sites of GALT1 stained GA structures are shown in g and quantitively assessed in h. Data are presented as means ± SD of triplicates of one representative experiment out of 2–4 repeats. (Two-way ANOVA, ***p < 0.001 versus untreated cells; #p < 0.05, ###p < 0.001 versus the presence of Noc). Size bar equals 10 µm
Fig. 6
Fig. 6
LTX-401, a Golgi apparatus (GA)-targeting oncolytic agent, induces the recruitment of the autophagic machinery to the GA. ac Treatment with the oncolytic compound, LTX-401 induces LC3 aggregation (GFP-LC3+) at the site of the GA that requires ATG5. WT and ATG5−/− human osteosarcoma U2OS cells expressing GFP-LC3 cells were treated with LTX-401 at different concentrations, for 6 h, in complete medium. The presence of serum partially decreased the cytotoxicity of LTX-401, allowing the study of its effects at the cellular level. Representative images of GALT1 immunostaining are shown in a, whereas the average area of GFP-LC3+ puncta and the level of colocalization between GFP-LC3+ and GALT1+ structures are depicted in b, c. Data indicate means ± SD of triplicates of one representative experiment out of 2–4 repeats. (Two-way ANOVA, *p < 0.5, ***p < 0.001 versus untreated cells; #p < 0.05,###p < 0.001 versus ATG5 knockout). Size bar equals 10 µm. df The GA-disrupting agents golgicide A (GCA) and brefeldin A (BFA) inhibited the aggregation of LC3 induced by LTX-401. U2OS cells expressing GFP-LC3 were treated with LTX-401 in the presence of BFA (5 µg/mL) or in the presence of GCA (5 µM) for 6 h followed by GALT1 immunostaining. Representative images are depicted in d and quantitative analysis showing average area of GFP-LC3+ puncta or GALT1+ structures, as well as the level of colocalization between GFP-LC3+ and GALT1+ structures, are presented in e, f. Data are presented as means ± SD of triplicates of one representative experiment out of 2–4 repeats. (Two-way ANOVA, ***p < 0.001 versus untreated cells; ###p < 0.001 versus the presence of BFA or GCA). Size bar equals 10 µm. gl LTX-401 induces GFP-LC3+ puncta, Golgi apparatus, p62, and lysosomes clustering. U2OS-GFP-LC3 cells were treated with LTX-401 for 6 h followed by immunostaining for p62 g or LAMP1 j proteins. Representative images are shown in g for p62 and in j for LAMP1. The quantitative analysis that reflects the colocalization of GFP-LC3+ puncta with p62+ or LAMP1+ structures are shown in h, k and the changes in the average area of p62+ or LAMP1+ structures after LTX-401 treatment are shown in i, l. Data are represented as means ± SD of triplicates of one representative experiment out of 2–4 repeats. (One-way ANOVA, *p < 0.5, **p < 0.01, ***p < 0.001 versus untreated cells). Size bar equals 10 µm. m, n Impact of different antioxidants on the LC3 aggregation mediated by LTX-401. U2OS cells expressing GFP-LC3 were incubated with the antioxidants n-acetyl-cysteine (NAC, 10 mM), glutathione (GSH, 5 mM), or tocopherol (TOC, 500 µM) for 3 h, followed by co-incubation with LTX-401 in the presence of the same antioxidants. Representative images are shown in m and the quantitative analysis that reflects the average area of GFP-LC3+ dots per cell are shown in n. Data are represented as means ± SD of triplicates of one representative experiment out of 2–4 repeats. (Two-way ANOVA, **p < 0.01,  ***p < 0.001 versus ctr cells; ns versus the presence of antioxidants). Size bar equals 10 µm
Fig. 7
Fig. 7
LC3 aggregation is independent of PIK3C3 and Beclin-1 but dependent on ATG5, ATG12 and ATG3. ah Human osteosarcoma U2OS wildtype or stably GFP-LC3 expressing cells were pre-treated with wortmannin (WORTM; 1 µM) or submitted to the RNA interference-mediated silencing of PIK3C3 and BCN1 followed by photodynamic therapy (PDT) with redaporfin (Redp*) a–e LTX-401 i, j, and m, n and torin k, l. Six hours later, LC3 aggregation was evaluated by microscopy in GFP-LC3 expressing cells whereas WT cells were processed for immunoblotting for the assessment of LC3 lipidation. MEFs WT or MEFs DKO for TSC2 and TP53 were also submitted to redp-PDT followed by the assessment of LC3 lipidation by means of immunoblotting f. Alongside, U2OS cells expressing GFP-LC3 cells were submitted to RNA interference-mediated silencing of 24 different autophagy-related genes followed by redp* g, h or LTX-401 o, p treatment. Six hours later, GFP-LC3+ puncta were evaluated by fluorescence microscopy. Representative images of GFP-LC3+ puncta are depicted for redp* a, g; LTX-401 i, o; or torin k and the quantitative analysis that shows the average area of GFP-LC3+ puncta is presented in b, h; j, p; and l, respectively. Representative western blots of LC3 lipidation are depicted in cf for redp* and in m, n for LTX-401. Data are presented as means ± SEM of at least two independent experiments. (Two-way ANOVA, ***p < 0.001 versus untreated cells; #p < 0.5, ##p < 0.01, ###p < 0.001 versus the presence of wortm or PIK3C3 or BCN1 silencing. For h, p, two-way ANOVA, ***p < 0.001 versus treated cells in the presence of the siCTR). Size bar equals 10 µm
Fig. 8
Fig. 8
ATG5/ATG7 knockout (KO) sensitizes cells to redaporfin-PDT (redp*) and oncolysis by LTX-401. ae Mouse embryonic fibroblasts (MEFs) wildtype (WT) as well as KO for Atg5/7 (Atg5/7−/−) were treated with redp* or with the oncolytic compound LTX-401 at the indicated concentrations. Six hours later, cell viability was evaluated by double-staining with PI and Hoechst 33342. Representative images are presented in a, d and the corresponding quantitative results regarding dying cancer cells (Hoechst bright and PI) and dead cells (PI+ cells) in b, e. c Cleaved caspase-3 (cCASP3) was evaluated by immunoblotting at 6 h post irradiation in MEFs WT as well as in MEFs KO for Atg5/7 (Atg5/7−/−). Data are presented as means ± SD of triplicates of one representative experiment out of three repeats. (*p < 0.5, **p < 0.01 versus untreated cells). Size bar equals 10 µm

References

    1. Klionsky DJ, Abdelmohsen K, Abe A, Abedin MJ, Abeliovich H, Acevedo Arozena A, et al. Guidelines for the use and interpretation of assays for monitoring autophagy (3rd edition) Autophagy. 2016;12:1–222. doi: 10.1080/15548627.2015.1100356. - DOI - PMC - PubMed
    1. Kabeya Y, Mizushima N, Ueno T, Yamamoto A, Kirisako T, Noda T, et al. LC3, a mammalian homologue of yeast Apg8p, is localized in autophagosome membranes after processing. EMBO J. 2000;19:5720–8. doi: 10.1093/emboj/19.21.5720. - DOI - PMC - PubMed
    1. Marino G, Niso-Santano M, Baehrecke EH, Kroemer G. Self-consumption: the interplay of autophagy and apoptosis. Nat Rev Mol Cell Biol. 2014;15:81–94. doi: 10.1038/nrm3735. - DOI - PMC - PubMed
    1. Fujita N, Itoh T, Omori H, Fukuda M, Noda T, Yoshimori T. The Atg16L complex specifies the site of LC3 lipidation for membrane biogenesis in autophagy. Mol Biol Cell. 2008;19:2092–2100. doi: 10.1091/mbc.e07-12-1257. - DOI - PMC - PubMed
    1. Tanida I, Ueno T, Kominami E. LC3 conjugation system in mammalian autophagy. Int J Biochem Cell Biol. 2004;36:2503–18. doi: 10.1016/j.biocel.2004.05.009. - DOI - PMC - PubMed

Publication types

MeSH terms