. 2018 Nov;24(11):1762-1772.
doi: 10.1038/s41591-018-0203-7. Epub 2018 Oct 22.

Antigen discovery and specification of immunodominance hierarchies for MHCII-restricted epitopes

Affiliations

Antigen discovery and specification of immunodominance hierarchies for MHCII-restricted epitopes

Daniel B Graham et al. Nat Med. 2018 Nov.

Abstract

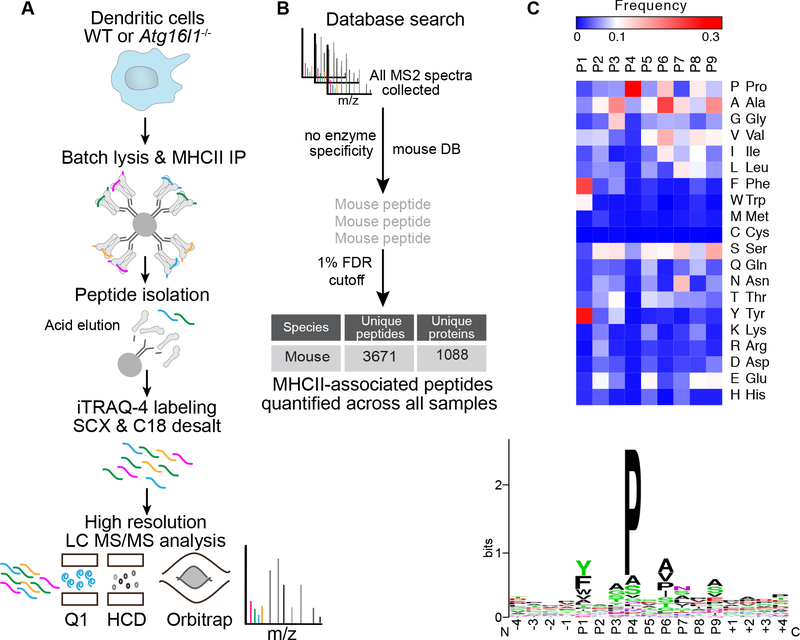
Identifying immunodominant T cell epitopes remains a significant challenge in the context of infectious disease, autoimmunity, and immuno-oncology. To address the challenge of antigen discovery, we developed a quantitative proteomic approach that enabled unbiased identification of major histocompatibility complex class II (MHCII)-associated peptide epitopes and biochemical features of antigenicity. On the basis of these data, we trained a deep neural network model for genome-scale predictions of immunodominant MHCII-restricted epitopes. We named this model bacteria originated T cell antigen (BOTA) predictor. In validation studies, BOTA accurately predicted novel CD4 T cell epitopes derived from the model pathogen Listeria monocytogenes and the commensal microorganism Muribaculum intestinale. To conclusively define immunodominant T cell epitopes predicted by BOTA, we developed a high-throughput approach to screen DNA-encoded peptide-MHCII libraries for functional recognition by T cell receptors identified from single-cell RNA sequencing. Collectively, these studies provide a framework for defining the immunodominance landscape across a broad range of immune pathologies.


Conflict of interest statement

Competing Financial Interests Statement

The authors declare no competing financial interests.

Figures

Figure 1.
Figure 1.. MHCII peptidomics in primary murine dendritic cells results in more than 3,700 distinct peptide identifications and defines the I-Ab-binding motif.
(A) Experimental workflow for immunopurification and sequencing of MHCII-associated peptides from murine dendritic cells. MHCII-peptide complexes were immunopurified from WT and Atg16l1−/− cells. Associated peptides were then acid-eluted, labeled with iTRAQ4 reagents, desalted with SCX and C18, and analyzed using high resolution LC-MS/MS. (B) A database search strategy for MHCII-peptide sequencing. All MS/MS spectra were searched against a database containing mouse proteins using Spectrum Mill software with a “no enzyme” specificity. Mouse peptides were validated using a 1% FDR cutoff, and the total numbers of peptides quantified across all samples were reported. (C) The I-Ab-binding motif was derived from endogenous mouse peptides bound to MHCII. Heatmap color coding represents the frequencies of each amino acid at each respective position.
Figure 2.
Figure 2.. Antigen processing pathways and epitope features revealed by MHCII peptidomics.
(A) Deficiency in the autophagy protein Atg16l1 skews the spectrum of MHCII-associated peptides. MHCII-bound peptides quantified in Atg6l1−/− dendritic cells relative to wild type (WT). Replicate (rep) samples were compared based on log2 fold change (FC) between mouse strains. Each dot represents a unique peptide sequence. Peptides that were observed to be significantly upregulated or downregulated are shown in red, while peptide measurements that were not reproducible across both biological replicates are shown in cyan. Dot plot axes: Log2FC. Histogram axes: number of distinct peptides. n=2 biologically independent samples per genotype in a single experiment. Reproducible replicates (95% limits of agreement of a Bland–Altman plot) were subjected to a moderated t-test to assess statistical significance. (B) Abundance and subcellular sources of MHCII-associated peptides derived from Atg6l1−/− and WT dendritic cells. (C) Epitope mapping relative to domain structure of endogenous antigens indicates preferential presentation of epitopes derived from the luminal/extracellular domains of transmembrane proteins and epitopes positioned between structurally-defined domains. (D) Immunodominant epitope prediction with BOTA. Workflow of BOTA with input as genome and output as a binding score. The upper panel shows the extraction of candidate peptides, and the lower panel shows the deep neural network core of the BOTA algorithm to assign a binding score to each candidate peptide. To extract candidate peptides, predicted genes from input genome are processed by HMMTOP, pfam domain search using HMMER3.0, and PSORT to define various features, which are later integrated, and candidate peptides are selected based on criteria previously described. To encode each candidate peptide with length l, amino acids are first encoded using a b-bit vector at random, and thus, the total amino acid space could be presented by a 20xb binary matrix. During the encoding process, a window of length k slides through the input peptide, thus forming l-k+1 windows for an input peptide with length l. This process is repeated for all d detectors, forming a d-HMM model scoring matrix X. Matrix X will then go through the regular rectify-max pool-neural network prediction route to generate a final output score, f, for each input peptide.
Figure 3.
Figure 3.. Validation of BOTA epitope predictions with MHCII peptidomics.
(A) Experimental workflow for immunopurification and sequencing of MHCII-associated peptides from murine dendritic cells. MHCII-peptide complexes were immunopurified from WT cells after a 10-minute or 6-hour Listeria treatment. Associated peptides were then acid-eluted, labeled with iTRAQ4 reagents, desalted with SCX and C18, and analyzed using high resolution LC-MS/MS. (B) MHCII-bound peptides (mouse and Listeria) detected before and after Listeria exposure. Biological replicates (rep) were compared based on log2 fold change (FC) between time 10 min and 6 hr after exposure to bacteria. Each dot represents a unique peptide sequence. Peptides that were observed to be significantly upregulated or downregulated are shown in red, while peptide measurements that were not reproducible across both biological replicates are shown in cyan. Dot plot axes: Log2FC. Histogram axes: number of distinct peptides. n=2 biologically independent samples per treatment in a single experiment. Reproducible replicates (95% limits of agreement of a Bland–Altman plot) were subjected to a moderated t-test to assess statistical significance. (C) Predictions for Listeria epitopes were made using the deep neural network core of BOTA. (D) The BOTA model pre-training accuracy plateaus after 200 epochs in cross-validation. The model was trained using the mouse peptides captured in BMDCs infected by Listeria (blue line); in contrast, the same model trained solely on Immune Epitope Database (IEDB) data reached a plateau at approximately 70%, signifying a 15% gap in accuracy. (E) Comparison of predictions for Listeria epitopes in proteins identified by proteomics. Peptides are split into categories based on the protein’s subcellular localization using PSORTb. (F) BOTA was used to predict epitopes for the human IBD risk allele (HLA-DRB1*01:03) that were annoted in IEDB as validated by MHCII binding assays or T cell reactivity assays. Full-length protein sequences associated with these epitopes were used as input for BOTA upstream modules. The output of BOTA upstream modules (trimmed protein sequences) was used as input for epitope prediction using netMHCIIpan with HLA-DRB1*01:03 specificity. This approach yielded 76% accuracy (Venn diagram BOTA predictions overlapping with validated IEDB epitopes) for predicting IEDB validated epitopes, with 12 epitopes missed by BOTA. In contrast netMHCIIpan predictions on full-length proteins without using BOTA upstream modules performed with 22% accuracy (Venn diagram netMHCIIpan predictions overlapping with validated IEDB epitopes), while 39 epitopes were missed by NetMHCIIpan.
Figure 4.
Figure 4.. BOTA and MHCII peptidomics accurately predict immunodominance in vivo.
(A) Epitope mapping and domain structure of Listeria antigens indicate preferential presentation of surface-exposed and secreted proteins. (B) Immunodominance of epitopes was determined by infecting mice with Listeria. At day 7, splenocytes were harvested and restimulated with the indicated peptides for quantification of the T cell response by IFNγ ELISPOT. Data represent the mean number of spots per 1×10⁵ CD4 T cells ± sd for n = 6 mice. (C, D and E) Immunodominance in vivo (IFNγ ELISPOT data from Figure 4B) correlates with fold change (FC) of Listeria peptides quantified by MHCII peptidomics (data from Figure 3B), and to a lesser extent, with mRNA expression of the corresponding peptide-encoding genes in Listeria derived from infected macrophages (previously published microarray).
Figure 5.
Figure 5.. Single cell RNAseq integrates T cell phenotype with TCR repertoire in the Listeria response.
Mice were inoculated with Listeria by i.p. injection on days 0 and 11. On day 18, FSCHICD4+CD8-B220-MHCII- T cells were FACS-sorted from spleens for single cell RNAseq and TCRseq. Sorted T cells were derived from 2 mice, sequenced separately, and combined for analysis. (A) Violin plots displaying Teff signature score derived from ImmGen. Each dot represents a single cell classified by clusters defined by tSNE. n=1920 cells from 2 mice. Limits of violin plot capture minima and maxima. (B) tSNE plot derived from T cell transcriptomes identifies distinct cell states that cluster according to unique signatures. Each dot represents a single cell that is color coded according to gene signature. n=1920 cells from 2 mice. (C) Circos plots of the linkages between the TCR alpha chain CDR3 and TCR beta chain CDR3. Ribbons link two chains with thickness proportional to the number of corresponding TCR pairs observed. Dominant TCR clones are labeled according to TCR gene segment usage. (D) Specifying antigen-reactivity by screening TCRs for reactivity with Listeria epitopes predicted by BOTA. HEK 293T cells were transfected to express peptide epitopes fused in-frame with the I-Abbeta chain bearing CD3zeta cytoplasmic domains. BW5147_CD4–28 cells were transduced to express chimeric single chain TCRs bearing the transmembrane and cytoplasmic domains of CD3zeta. In this coculture system, cognate antigen recognition results in T cell activation characterized by production of IL-2. (E) The most abundant TCR identified in mice infected with Listeria (lmo_R6) was screened for reactivity against Listeria epitopes as described above. IL-2 was detected in culture supernatant by cytometric bead array. As controls, OT2 TCR (reactive with Ova) and LLO_118 TCR (reactive with LLO) were included. (F) HEK 293T cells were transfected with constructs encoding single chain TCRs. Cells were analyzed by FACS for expression of TCRb and binding to LLO I-Ab tetramers (NEKYAQAYPNVS I-Ab). Data represent a single experiment.
Figure 6.
Figure 6.. Computational prediction and validation of a dominant commensal antigen.
(A) Mice were administered DSS to induce colitis prior to analysis by SICC-seq. At day 14, serum was collected and incubated with stool to allow binding of IgG with commensals. IgG-positive and -negative fractions were separated with magnetic beads covalently attached to protein A/G. The immunogenicity of Bacteroidales was demonstrated by IgG-reactivity score (relative abundance in IgG-positive minus IgG-negative fractions) derived from 16s sequencing. (B) BOTA identified SusC, a highly represented epitope within and across Bacteroidales genomes, including the murine commensal Muribaculum intestinale. Splenocytes from naive mice were harvested and stimulated in vitro with SusC peptide or DMSO control. Cytokines were measured 24 hours later by cytometric bead array. Data represent the mean cytokine concentration ± sd for n = 7 mice. **P<0.0001 as determined by unpaired two-tailed Student’s T test.

Similar articles

Cited by

References

    1. Babbitt BP, Allen PM, Matsueda G, Haber E & Unanue ER Binding of immunogenic peptides to Ia histocompatibility molecules. Nature 317, 359–361 (1985). - PubMed
    1. Stern LJ, et al. Crystal structure of the human class II MHC protein HLA-DR1 complexed with an influenza virus peptide. Nature 368, 215–221 (1994). - PubMed
    1. Kim A & Sadegh-Nasseri S Determinants of immunodominance for CD4 T cells. Curr. Opin. Immunol 34, 9–15 (2015). - PMC - PubMed
    1. Arunachalam B, Phan UT, Geuze HJ & Cresswell P Enzymatic reduction of disulfide bonds in lysosomes: characterization of a gamma-interferon-inducible lysosomal thiol reductase (GILT). Proc. Natl. Acad. Sci. U. S. A 97, 745–750 (2000). - PMC - PubMed
    1. Hsieh CS, deRoos P, Honey K, Beers C & Rudensky AY A role for cathepsin L and cathepsin S in peptide generation for MHC class II presentation. J. Immunol 168, 2618–2625 (2002). - PubMed
References for Methods
    1. Janeway CA Jr., et al. Monoclonal antibodies specific for Ia glycoproteins raised by immunization with activated T cells: possible role of T cellbound Ia antigens as targets of immunoregulatory T cells. J. Immunol 132, 662–667 (1984). - PubMed
    1. Andreatta M, Schafer-Nielsen C, Lund O, Buus S & Nielsen M NNAlign: a web-based prediction method allowing non-expert end-user discovery of sequence motifs in quantitative peptide data. PLoS ONE 6, e26781(2011). - PMC - PubMed
    1. Zhu Y, Rudensky AY, Corper AL, Teyton L & Wilson IA Crystal structure of MHC class II I-Ab in complex with a human CLIP peptide: prediction of an I-Ab peptide-binding motif. J. Mol. Biol 326, 1157–1174 (2003). - PubMed
    1. Liu X, et al. Alternate interactions define the binding of peptides to the MHC molecule IA(b). Proc. Natl. Acad. Sci. U. S. A 99, 8820–8825 (2002). - PMC - PubMed
    1. Yu NY, et al. PSORTb 3.0: improved protein subcellular localization prediction with refined localization subcategories and predictive capabilities for all prokaryotes. Bioinformatics 26, 1608–1615 (2010). - PMC - PubMed

Publication types

MeSH terms

Substances