. 2018 Oct 22;8(1):15563.
doi: 10.1038/s41598-018-32845-w.

Evaluation of plant contamination in metabarcoding diet analysis of a herbivore

Affiliations

Evaluation of plant contamination in metabarcoding diet analysis of a herbivore

Haruko Ando et al. Sci Rep. .

Abstract

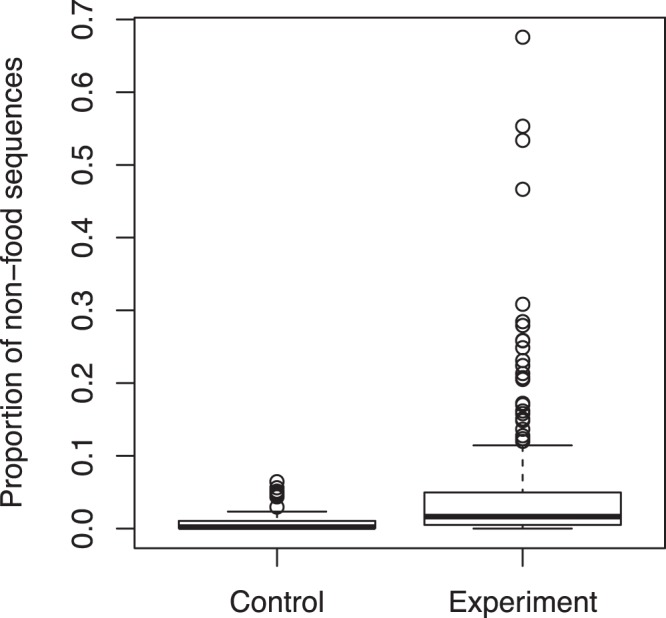
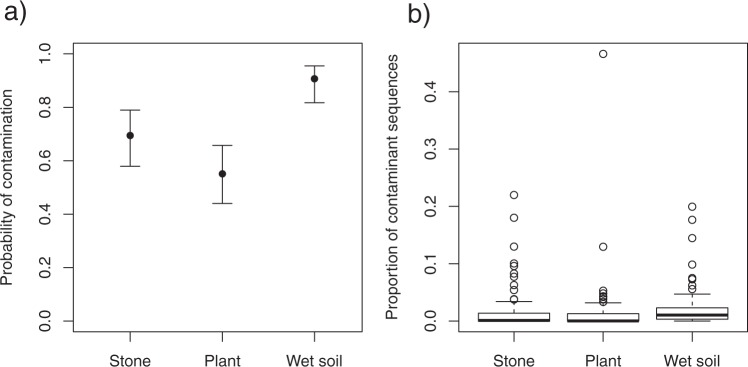
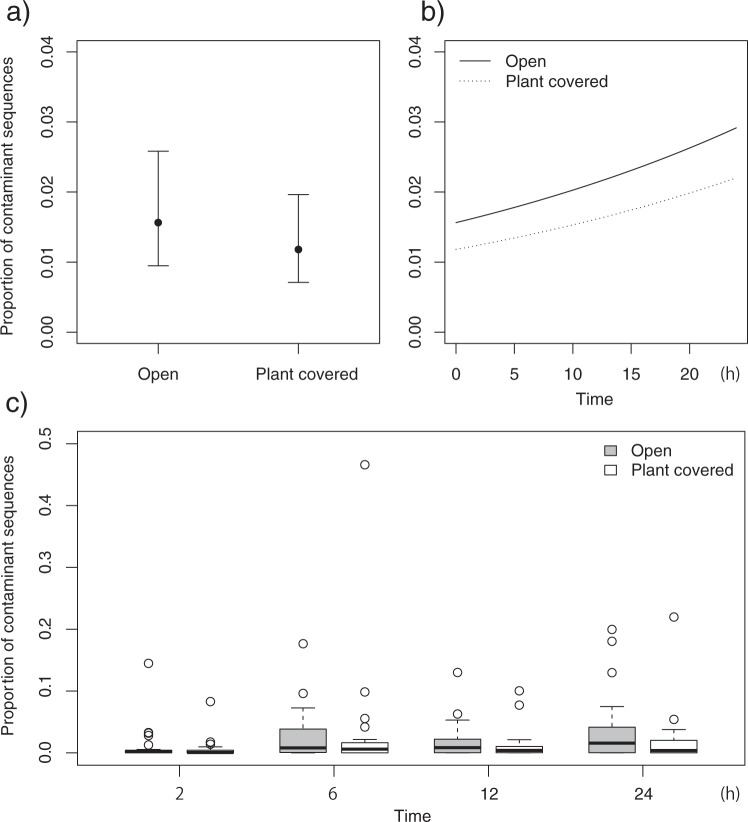
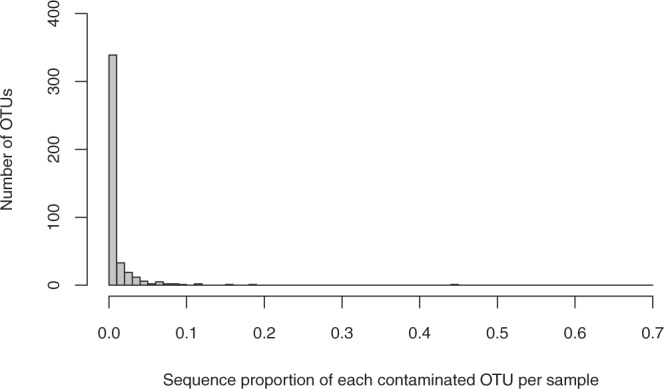
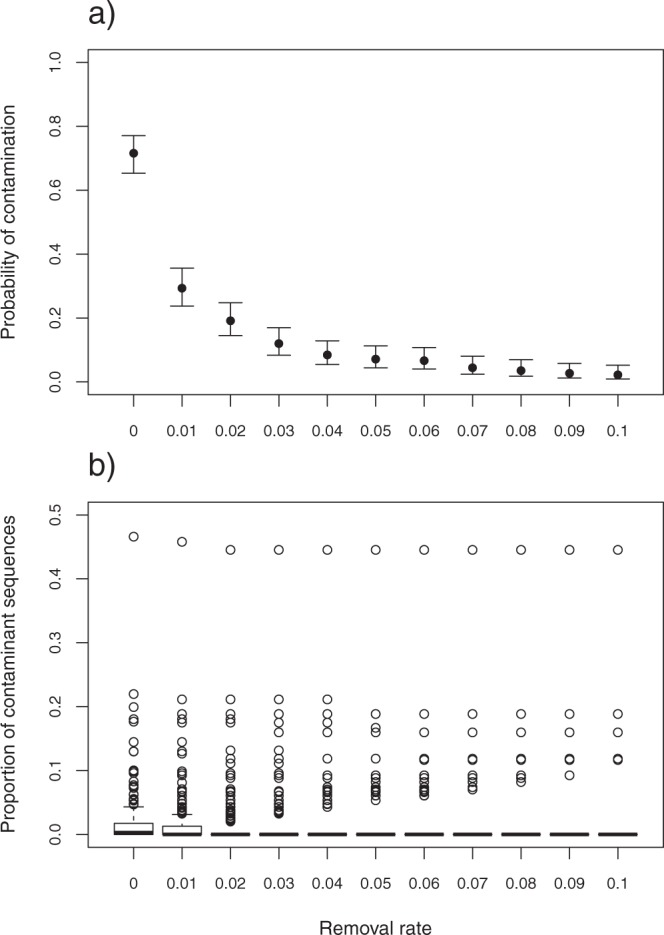
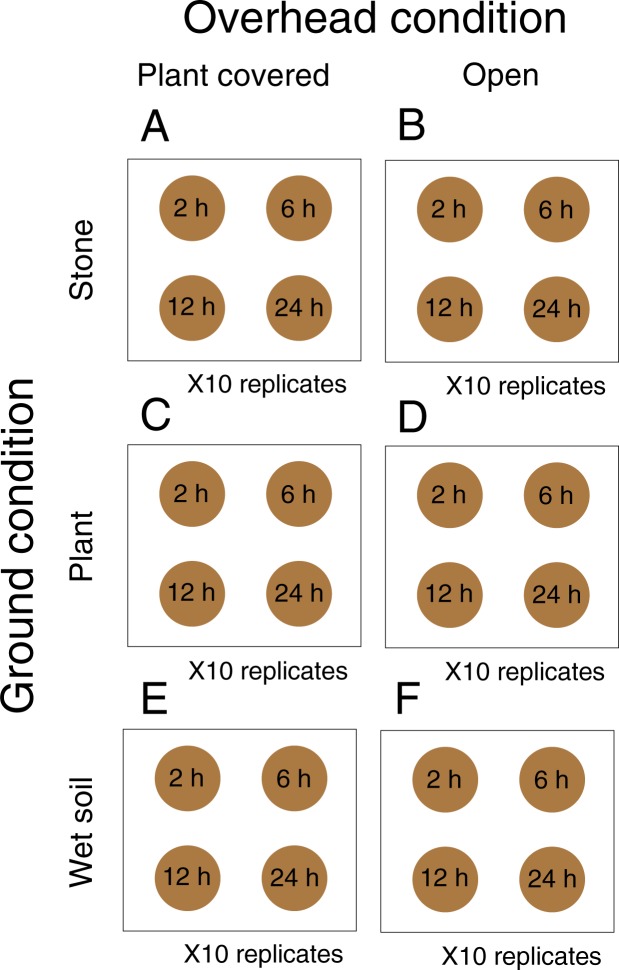
Fecal DNA metabarcoding is currently used in various fields of ecology to determine animal diets. Contamination of non-food DNA from complex field environments is a considerable challenge to the reliability of this method but has rarely been quantified. We evaluated plant DNA contamination by sequencing the chloroplast trnL P6 loop region from food-controlled geese feces. The average percentage of contaminant sequences per sample was 1.86%. According to the results of generalized linear models, the probability of contamination was highest in samples placed in wet soil. The proportion of contaminant sequences was lowest at the earliest sampling point and was slightly higher in samples placed in open conditions. Exclusion of rare OTUs (operational taxonomic units) was effective for obtaining reliable dietary data from the obtained sequences, and a 1% cutoff reduced the percentage of contaminated samples to less than 30%. However, appropriate interpretation of the barcoding results considering inevitable contamination is an important issue to address. We suggest the following procedures for fecal sampling and sequence data treatment to increase the reliability of DNA metabarcoding diet analyses: (i) Collect samples as soon as possible after deposition, (ii) avoid samples from deposits on wet soil, and (iii) exclude rare OTUs from diet composition estimations.


Conflict of interest statement

The authors declare no competing interests.

Figures

Figure 1
Figure 1
Non-food sequence proportions of the control and treatment samples.
Figure 2
Figure 2
Composition of plant taxa detected from contaminant sequences in samples from six experimental conditions.
Figure 3
Figure 3
Probabilities of contamination and proportions of contaminant sequences among ground conditions (stone, plant, wet soil). (a) Mean predicted values and 95% confidence intervals for the probability of occurrence of contaminated samples predicted by the best-fit generalized linear model. (b) Box plot of the proportions of contaminant sequences.
Figure 4
Figure 4
Proportions of contaminant sequences under different overhead conditions (open, plant covered). (a) Mean predicted values and 95% confidence intervals predicted by the best-fit generalized linear model. (b) Regression curves of the best-fit GLM of contaminant-sequence proportion as a function of time since the samples were placed on the experimental plots. (c) Box plot of contaminant-sequence proportion for each overhead condition and time.
Figure 5
Figure 5
Frequency distribution of the sequence proportions of each contaminant OTU per sample.
Figure 6
Figure 6
Probabilities of contamination and proportions of contaminant sequences among eleven cutoff values of rare OTU removal. (a) Mean predicted values and 95% confidence intervals for the probability of occurrence of contaminated samples predicted by the generalized linear model. (b) Box plot of the proportions of contaminant sequences.
Figure 7
Figure 7
Sampling design of this study. We combined two overhead conditions (open/plant covered) and three ground conditions (stone/plant/wet soil). The gray circles represent fecal samples exposed to each environmental condition, and exposure time is presented within the circles.

References

    1. Kress WJ, Garcia-Robledo C, Uriarte M, Erickson DL. DNA barcodes for ecology, evolution, and conservation. Trends Ecol. Evol. 2015;30:25–35. doi: 10.1016/j.tree.2014.10.008. - DOI - PubMed
    1. Pompanon F, et al. Who is eating what: diet assessment using next generation sequencing. Mol. Ecol. 2012;21:1931–1950. doi: 10.1111/j.1365-294X.2011.05403.x. - DOI - PubMed
    1. Valentini A, Pompanon F, Taberlet P. DNA barcoding for ecologists. Trends Ecol. Evol. 2009;24:110–117. doi: 10.1016/j.tree.2008.09.011. - DOI - PubMed
    1. Valentini A, et al. New perspectives in diet analysis based on DNA barcoding and parallel pyrosequencing: the trnL approach. Mol. Ecol. Resour. 2009;9:51–60. doi: 10.1111/j.1755-0998.2008.02352.x. - DOI - PubMed
    1. Ando H, et al. Diet analysis by next-generation sequencing indicates the frequent consumption of introduced plants by the critically endangered red-headed wood pigeon (Columba janthina nitens) in oceanic island habitats. Ecol. Evol. 2013;3:4057–4069. doi: 10.1002/ece3.773. - DOI - PMC - PubMed