. 2018 Nov;21(11):1551-1562.
doi: 10.1038/s41593-018-0251-9. Epub 2018 Oct 22.

A highly collateralized thalamic cell type with arousal-predicting activity serves as a key hub for graded state transitions in the forebrain

Affiliations

A highly collateralized thalamic cell type with arousal-predicting activity serves as a key hub for graded state transitions in the forebrain

Ferenc Mátyás et al. Nat Neurosci. 2018 Nov.

Abstract

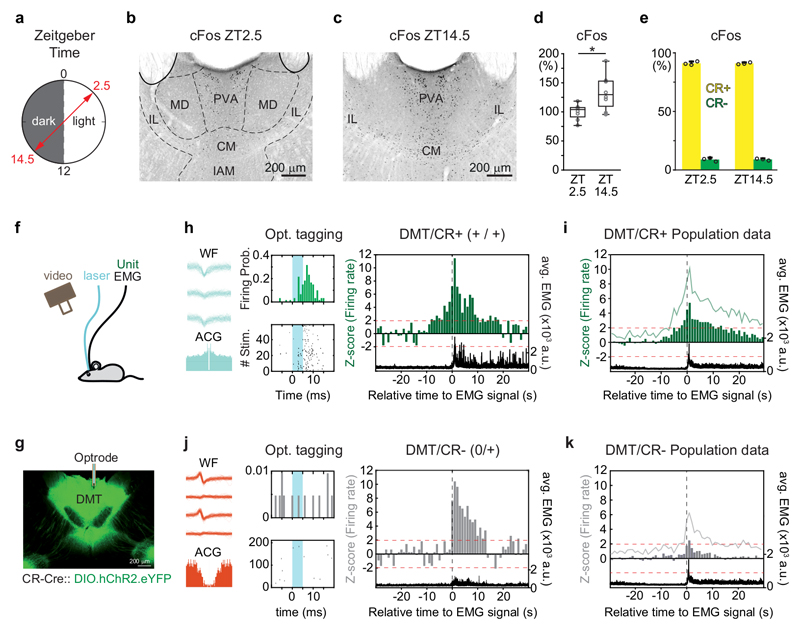
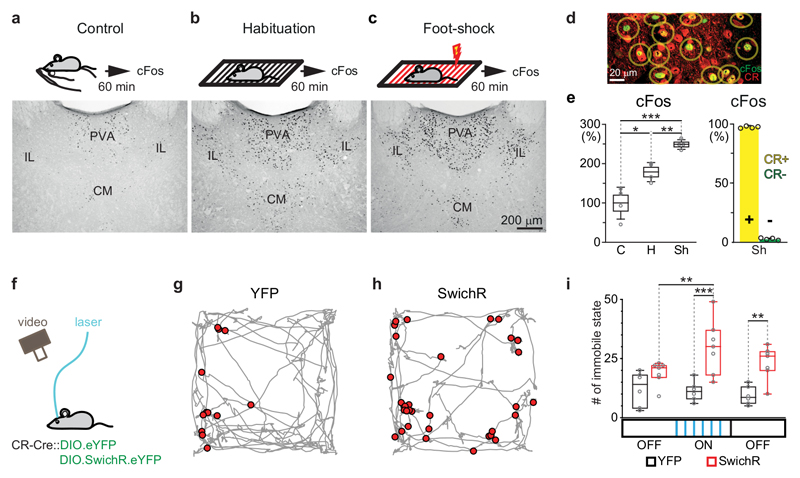
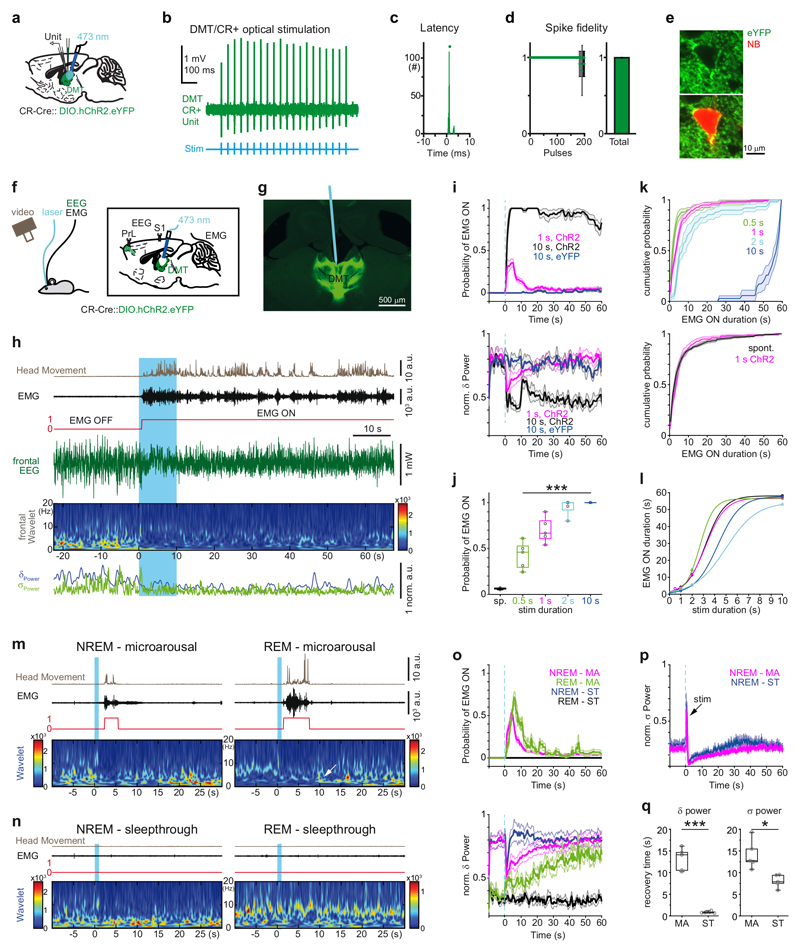
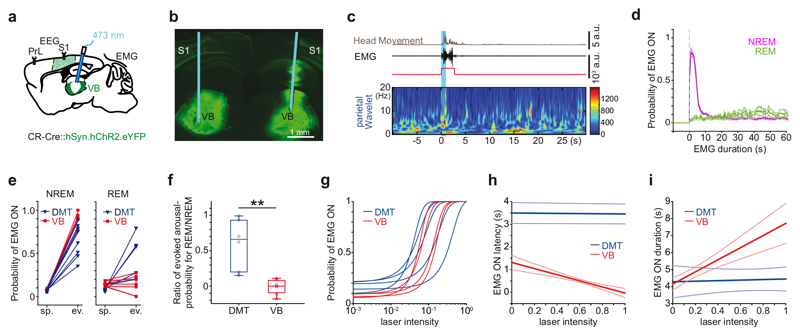
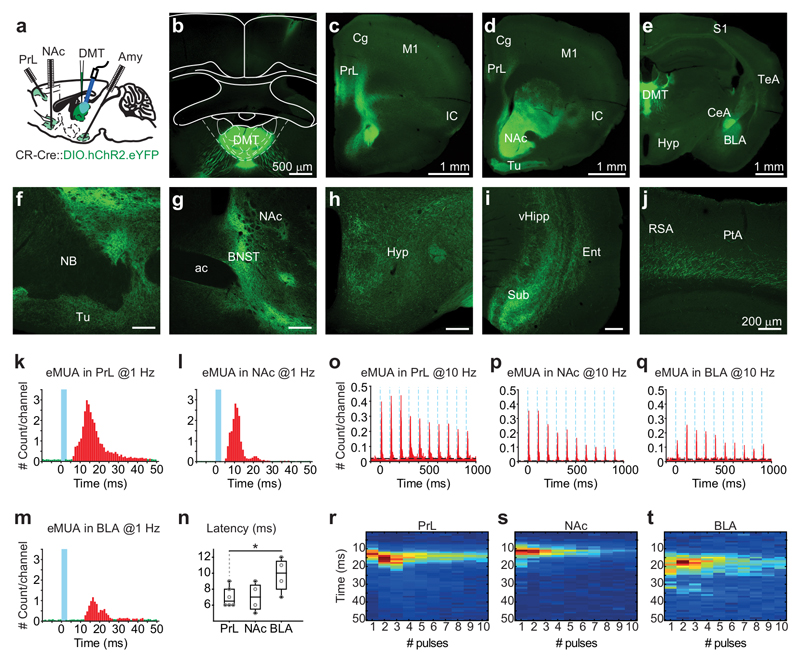
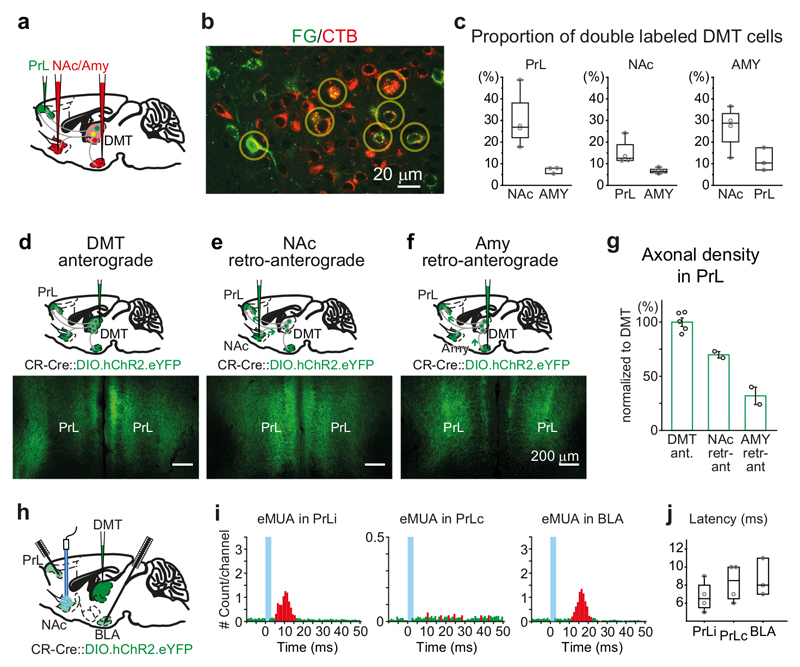
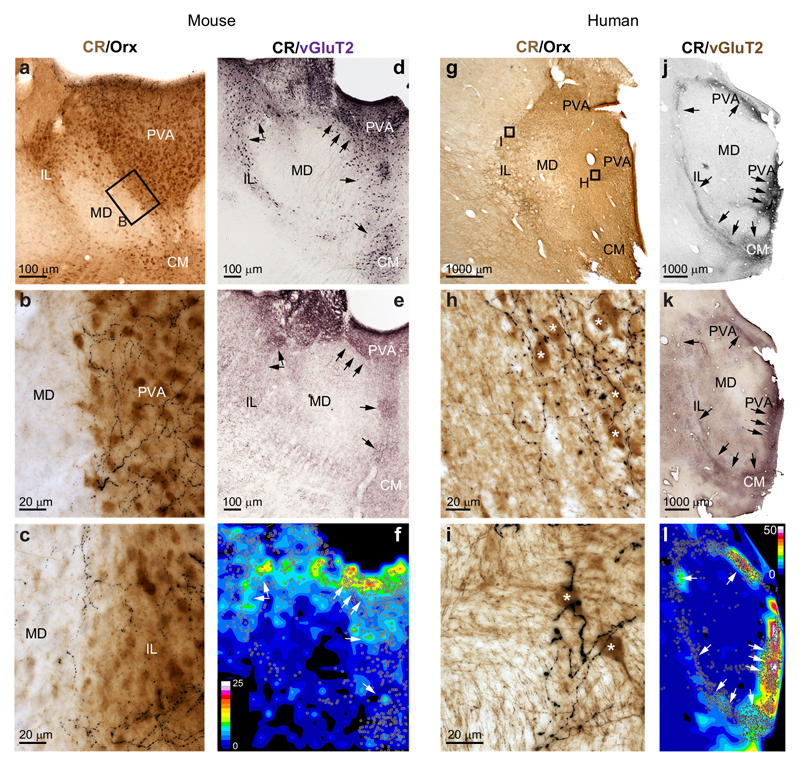
Sleep cycles consist of rapid alterations between arousal states, including transient perturbation of sleep rhythms, microarousals, and full-blown awake states. Here we demonstrate that the calretinin (CR)-containing neurons in the dorsal medial thalamus (DMT) constitute a key diencephalic node that mediates distinct levels of forebrain arousal. Cell-type-specific activation of DMT/CR+ cells elicited active locomotion lasting for minutes, stereotyped microarousals, or transient disruption of sleep rhythms, depending on the parameters of the stimulation. State transitions could be induced in both slow-wave and rapid eye-movement sleep. The DMT/CR+ cells displayed elevated activity before arousal, received selective subcortical inputs, and innervated several forebrain sites via highly branched axons. Together, these features enable DMT/CR+ cells to summate subcortical arousal information and effectively transfer it as a rapid, synchronous signal to several forebrain regions to modulate the level of arousal.


Figures

Figure 1
Figure 1. DMT/CR+ cells show arousal-related activation
a, Experimental setting for cFos immunostaining in DMT at two distinct time points of the dark-light phase according to the Zeitgeber Time (ZT). b-c, Representative images of cFos expression in DMT at ZT2.5 (dark phase) and at ZT14.5 (light phase). d, Quantitative data for cFos expression at ZT14.5 normalized to ZT2.5 in DMT (n = 8-8 mice; two-tailed unpaired t-test, t(14) = -2,826, p = 0,0135). e, Co-localization of CR in cells displaying cFos positivity at ZT2.5 (light phase, n=3 mice, 1140/1253 neurons) and ZT14.5 (dark phase, n=3 mice, 1565/1723 neurons). f, Schematic drawing for electrophysiological recordings of DMT cells during natural sleep. g, Confocal image of a coronal section with cannula track (white bar) guiding optrode into the AAV-ChR2-eYFP (green) labeled DMT/CR+ region. h, Waveforms (WF) in three out of the four tetrode electrodes, autocorrelogram (ACG; left, bottom) and peri-event time histogram upon optogenetic tagging of a DMT/CR+ cell (middle). Right, the same cell started to increase its firing activity preceding the behavioral arousal (black dashed line) by several seconds and maintained elevated firing after the EMG onset as well. ‘+/+, increased activity before/after the arousal; black trace, EMG signal. i, Population data for the activity of DMT/CR+ at the sleep/wake transition (n = 31 neurons). j, As in h, for a non-tagged (putative CR-) cell. Note the lack of significant increase in firing activity before the onset of movement. k, Population data for the activity of DMT/CR- units at the sleep/wake transition (n = 34 neurons). 1 sec bins indicates the averages of z-scores. Green lines, variance (SD) of z-scores; black, averaged EMG signal; black vertical dashed line, EMG onset; red horizontal dashed line, z-score value 1.96 (p < 0.05). Bar graphs are means ± SD; open circles in d and e represent data for single animals; the horizontal lines in the box plots indicate medians, the box limits indicate first and third quantiles, and the vertical whisker lines indicate minimum and maximum values. *p < 0.05. CM, central medial thalamic nucleus; IAM, interanteromedial thalamic nucleus; IL, intralaminar thalamic nuclei; MD, mediodorsal thalamic nuclei; PVA, paraventricular thalamic nucleus, anterior part.
Figure 2
Figure 2. cFos content and optogenetic inhibition of DMT/CR+ cells in situations with distinct arousal levels
a-c, Schematic drawing of the experimental design (top) and representative images of cFos expressions (bottom) in DMT following handling (a), habituation (no shock); b) and foot shock (c). d, Representative confocal image of the co-localization of cFos and CR in DMT cells in a foot-shock case. e, Left, Normalized data for cFos expressing DMT cells in Control (C), Habituation (H) and Shock (Sh) situations (n= 4-4mice; control: 100 ± 40%; habituation: 179 ± 24%, shock: 249 ± 12%; two-tailed unpaired t-test, C vs. H, t(6) = -3,339, p = 0.0156; H vs. Sh, t(6) = -5,152, p = 0.0021; C vs. Sh, t(6) = -7,043, p = 0.0004). Right, CR-content (right) of cFos expressing cells in case of Sh. Yellow bar indicates CR+/cFos+ cells (1393/1433 neurons, 97.2%; n=4 mice), green bar CR-/cFos+ cells (40/1433, neurons, 2.8%). f, Schematic drawing for optogenetic inhibition of DMT/CR+ in a novel environment. g-h, Representative data for short immobile states (red dots) evoked by optogenetic silencing during the exploration of a novel box (grey) in a YFP (control, g) and a SwichR-injected mouse (h). i, Population data for the number of immobile states during the pre-OFF (3 mins), ON (3 mins) and post-OFF (3 mins; see Methods) periods in the YFP (n = 6 mice; pre OFF n = 12.2± 3.0; ON period n = 11.2 ± 1.7, post OFF n = 9.3 ± 1.6) and SwichR-injected animals (n = 7 mice; pre OFF n = 18.9 ± 1.9; ON period n = 29.9 ± 4.4, post OFF n = 23.3 ± 2.7). Repeated-measures ANOVA with Fisher’s LSD, F(2, 22) = 3.4945, p = 0.0481. CM, centromedial thalamic nucleus; IL, intralaminar thalamic nuclei; PVA, paraventricular thalamic nucleus, anterior part. Bar graphs are means ± SD; open circles in e and i represent data for single animals; the horizontal lines in the box plots indicate medians, the box limits indicate first and third quantiles, and the vertical whisker lines indicate minimum and maximum values. *p < 0.05; **p < 0.01, ***p < 0.001.
Figure 3
Figure 3. Stimulation of DMT/CR+ induces behaviorally relevant arousal patterns.
a, Experimental setting for anaesthetized in vivo recordings. b, Optogenetic tagging of a DMT/CR+ cell. c, Peri-event time histogram of light-evoked spike latency. d, Spike response probability to 10 sec 20 Hz stimulation (left). Summated values (right). e, Confocal fluorescent image of an optogenetically tagged, ChR2-eYFP-positive (green) and neurobiotin (red) filled DMT neuron. f, Experimental setting for in vivo recordings and optogenetic stimulation in freely sleeping mice. g, Post hoc identification of the optic fiber’s track among ChR2-eYFP-expressing DMT/CR+ neurons. h, Persistent arousal evoked by 10 sec optogenetic stimulation of DMT/CR+ (blue period). i, Average (mean) peri-event distribution of EMG ON states (top) and the corresponding delta power (bottom) in mice (n = 8) expressing ChR2 in DMT/CR+ cells after 1 and 10 sec stimulations (red and black, respectively). Data from control (YFP) mice are shown with blue (n = 3). Blue vertical dashed line, onset of the optogenetic stimulation. j, Average probability of spontaneous and evoked arousal using different stimulus durations (n = 5 mice, spontaneous (sp), 0.06 ± 0.01; 0.5 sec, 0.43 ± 0.15; 1 sec, 0.70 ± 0.14; 2 sec, 0.95 ± 0.09; 10 sec, 1.00 ± 0; Repeated measures of ANOVA for evoked trials, F(3,12) = 34.307, p < 0.0001; pairwise comparison with Bonferroni correction shows significant difference only for 0.5 sec vs 1 sec, p = 0.017; 0.5 sec vs 2 sec, p = 0.019; 0.5 sec vs 10 sec, p = 0.006). k, Cumulative probability distribution of the duration of EMG ON states in case of 0.5, 1, 2, and 10 sec stimulations (n = 5 mice) (top). Comparison of spontaneous and evoked microarousals (1 sec stimulation, bottom): 3.69 ± 1.31 sec for evoked and 3.23 ± 1.27 sec for spontaneous, n = 8 mice; two-tailed paired t-test for group data, t(7) = -1.82, p = 0.111; Kolmogorov-Smirnov test for animal-wise comparison, p > 0.05; in 7/8 animal). l, Correlation of stimulus durations and arousal lengths in five individual animals fitted with sigmoid. m, Microarousals during NREM (left) and REM (right) states evoked by 1 sec long stimulation of DMT/CR+ cells. Note the state change from REM to NREM after REM microarousals indicated by the appearance of high values in the delta range (white arrow). n, Subthreshold stimulations (sleep-through) during NREM (left) and REM (right) states. o, Average (mean) peri-event distribution of EMG ON states (top) and delta power (bottom) in case of microarousals (MA) and sleep-throughs (ST) during NREM and REM states (n = 5 mice). Note longer microarousals in REM (green, top), the return of NREM after REM MA indicated by the increasing delta values. Note also the rapid return of delta power in case of NREM-ST (bottom). p, Prolonged disruption of sigma band both in case of microarousals MA and sleep-through. The sharp peak at time 0 (black arrow) represents the evoked response of 10 Hz stimulation in the frontal cortex. q, Recovery time constants for delta and sigma powers in case of NREM microarousals and sleep-throughs (n = 5 mice, Delta-MA, 13.12 ± 2.34 sec; Delta-ST, 0.85 ± 0.23 sec; two-tailed paired t-test t(4) = 11.116, p < 0.0001 and Sigma-MA, 14.14 ± 2.98 sec; Sigma-ST, 8.03 ± 1.32 sec ; two-tailed paired t-test t(4) = 4.114, p = 0.015). The horizontal lines in the box plots indicate medians, the box limits indicate first and third quantiles, and the vertical whisker lines indicate minimum and maximum values. *p < 0.05; ***p < 0.001. Shaded areas represent ± s.e.m.
Figure 4
Figure 4. Microarousals evoked by DMT/CR+ cells and sensory nuclei
a, Schematic diagram for the experimental settings. b, Position of the optic fiber in a coronal section of VB expressing ChR2-eYFP. c, Microarousal during NREM (left) evoked by 1 sec long stimulation of VB cells. d, Average (mean) peri-event distribution of EMG ON states shows high probability during NREM (purple; 0.91 ± 0.07, n = 7 unilateral stimulation from 4 mice). VB stimulation was ineffective in REM sleep (green) in response to 1 sec stimulation (blue dashed line). Shaded area represents ± s.e.m. e, Spontaneous and evoked rate of microarousal induced by 1 sec stimulation of DMT/CR+ (blue) or VB (red) in NREM (left) and REM (right) sleep. f, Arousal probability in REM normalized to arousal probability in NREM for DMT/CR+ (blue) and VB mice (red). (VB, n = 7; DMT, n = 6; 2*one-tailed Mann-Whitney, p = 0.0011). The horizontal lines in the box plots indicate medians, the box limits indicate first and third quantiles, and the vertical whisker lines indicate minimum and maximum values. The whiskers extend to the most extreme data points. g, Correlation of laser intensity and arousal probability. Sigmoid was fitted for each animal. To enable comparison of sigmoid slopes between groups, both laser intensities and arousal probabilities were normalized to their maximal values within each mouse. The slope of sigmoid curves showed individual variability, but on average, there was no significant difference between VB and DMT/CR+ animals (VB, n = 4, DMT n = 5 mice; 2*one-tailed Mann-Whitney, p = 0.142). h, Correlation of laser intensity vs. microarousal latency. dMT-latency: r = -0.05+-0.11; p: n.s in n= 4/5 animals, individual p values: p = 0.023; p = 0.371; p = 0.476; p = 0.57; p = 0.476; VB latency: r = -0.275+-0.09, n= 4 hemisphers, individual p values: p = 0.0028; p = 0.0005; p = 0.0001; p = 0.0001. i, Correlation of laser intensity vs. microarousal duration. DMT duration: r = 0.01+-0.07; p: n.s in n = 5 animals; individual p values: p = 0.28; p = 0.35; p = 0.59; p = 0.60; p = 0.85. VB-duration: r = 0.2+-0.05; in n = 4 hemispheres, individual p values: p = 0.034; p = 0.001; p = 0.0005; p = 0.0001. Thin blue and red lines represents ± s.e.m.
Figure 5
Figure 5. Functional connectivity of DMT/CR+ cells
a, Experimental setting for simultaneous in vivo multiunit recordings from three target regions of DMT/CR+. b-j, Distribution of DMT/CR+ axons in the mouse forebrain. Injection site of AAV-DIO-ChR2-eYFP in DMT of a CR-Cre mouse (in b). Similar data were obtained in 29 mice. k-m, Normalized peri-event time histogram of evoked MUA (eMUA) responses in PrL (k), NAc (l) and BLA (m) at 1 Hz light stimulation of DMT/CR+ (blue line). Bins in red are significantly larger than baseline (green). n, Population data for latencies of eMUA in PrL (7 ± 1.26 ms, n = 6), NAc (7 ± 1.83 ms, n = 4) and BLA (9.75 ± 2.22 ms; n = 4; two-tailed unpaired t-test, PrL vs. BLA, t(8) = -2,526, p = 0.0354). o-q, Normalized peri-event time histogram of eMUA responses in PrL (o), NAc (p) and BLA (q) at 10 Hz light stimulation (blue dotted lines) of DMT/CR+. r-t, Normalized heat map showing peak latencies of eMUA at 10 Hz in PrL (r), NAc (s) and BLA (t). The horizontal lines in the box plots indicate medians, the box limits indicate first and third quantiles, and the vertical whisker lines indicate minimum and maximum values. *p < 0.05. ac, anterior commissure; Amy, amygdala; BLA, basolateral amygdala; BNST, bed nucleus of the stria terminalis; CeA, central amygdala; Cg, cingulate cortex; DMT, dorsal medial thalamus; Ent, entorhinal cortex; Hyp, hypothalamus; IC, insular cortex; M1, primary motor cortex; NAc, n. accumbens; NB, nucleus basalis; PrL, prelimbic cortex; PtA; parietal association cortex; RSA, retrosplenial agranular cortex; S1, primary somatosensory cortex; Sub, subiculum; TeA, temporal association cortex; Tu, olfactory tubercle; vHipp, ventral hippocampus.
Figure 6
Figure 6. Extensive collateralization of DMT/CR+ cells in multiple forebrain regions
a, Experimental design for double retrograde tracings. b, Confocal fluorescent image of FG (from PrL; green) and CTB (from NAc; red) – labeled thalamic cells in DMT. Yellow circles indicate double-labeled cells. c, Proportion of PrL- (left), NAc- (middle) and Amy-projecting (right) DMT cells which also project to the other two regions as measured by double retrograde tracing (PrL-AMY, n=3 mice; PrL-NAc, n=4; AMY-NAc; n=4). d-f, Schematic drawing (top) and representative confocal images (bottom) of DMT/CR+ axonal arbors in PrL obtained by direct, anterograde virus labeling from DMT (d) or after injecting the virus to NAc (e) and AMY (f) utilizing retro-anterograde transport of the viral particles. g, Population data of the length of DMT/CR+ axon arbors in PrL after direct anterograde labeling from the DMT (DMT Ant; n = 5 mice) or after retro-anterograde labeling from NAc (NAc retr-ant; n = 2 mice) or AMY (AMY retr-ant, n = 2 mice). h, Experimental design for in vivo anesthetized multiunit recording and antidromic optogenetic stimulation. i, Antidromic stimulation of DMT/CR+ fibers in NAc evokes antidromic-orthodromic multi-unit activations (eMUA) in ipsilateral PrL (iPrL) and BLA but not in the contralateral PrL (cPrL). Blue lines indicate optogenetic stimulation, red/green bars represent those bins in which the MUA was significantly elevated/unchanged (respectively) compared to the baseline. j, Latencies of antidromic-orthodromic eMUA measured in PrLi (6.75 ± 1.7 ms; n = 4 mice), PrLc (8.25 ± 2.1 ms; n = 4 mice) and BLA (8.7 ± 2.1 ms; n = 3 mice) which did not differ from the direct orthodromic eMUA (two-tailed paired t-test, PrL, t(8) = 0,268, p = 0.7957; BLA, t(5) = 0,655, p = 0.5411). Bar graphs are means ± SD; the horizontal lines in the box plots indicate medians, the box limits indicate first and third quantiles, and the vertical whisker lines indicate minimum and maximum values.
Figure 7
Figure 7. Selective subcortical innervation of DMT/CR+ cells in mice and human.
a, Low-power double immunostaining of mouse DMT for CR (brown) and orexin (Orx, black) (n = 4 mice). Small box represents the enlarged area in b. b-c, High power images from the midline (b) and intralaminar (c) regions. Note that the orexin-positive fibers are restricted to regions populated by CR+ cells. d-e, Low power immunostaining for CR (d) and vGluT2 (e) of the mouse DMT. f, Heat-map representing staining density shows large overlap between vGlut2 terminals and the position of CR+ cell bodies in the midline and dorsal intralaminar region. g-i, Same images as a-c in the human thalamus (n = 4 humans). Small boxes indicate the position of high power images. j-l, Same images as d-f in the human thalamus. Scale of the density map: 0-25 bouton/1000 μm2 (mouse) and 0-50 bouton/1000 μm2 (human). CM, central Medial thalamic nucleus; IL, intralaminar thalamic nuclei; MD, mediodorsal thalamic nuclei; PVA, paraventricular thalamic nucleus, anterior part.

References

    1. Saper CB, Fuller PM, Pedersen NP, Lu J, Scammell TE. Sleep state switching. Neuron. 2010;68:1023–42. - PMC - PubMed
    1. Brown RE, Basheer R, McKenna JT, Strecker RE, McCarley RW. Control of sleep and wakefulness. Physiol Rev. 2012;92:1087–187. - PMC - PubMed
    1. Halász P, Bódizs R. Dynamic Structure of NREM Sleep. Springer-Verlag; 2013.
    1. Terzano MG, Parrino L. Origin and Significance of the Cyclic Alternating Pattern (CAP). REVIEW ARTICLE. Sleep Med Rev. 2000;4:101–123. - PubMed
    1. Schieber JP, Muzet A, F P. Phases of spontaneous transitory activation during normal sleep in humans. Arch Sci Physiol. 1971;25:443–65. - PubMed

Publication types

LinkOut - more resources