. 2018 Nov;50(11):1553-1564.
doi: 10.1038/s41588-018-0244-3. Epub 2018 Oct 22.

Chromatin run-on and sequencing maps the transcriptional regulatory landscape of glioblastoma multiforme

Affiliations

Chromatin run-on and sequencing maps the transcriptional regulatory landscape of glioblastoma multiforme

Tinyi Chu et al. Nat Genet. 2018 Nov.

Abstract

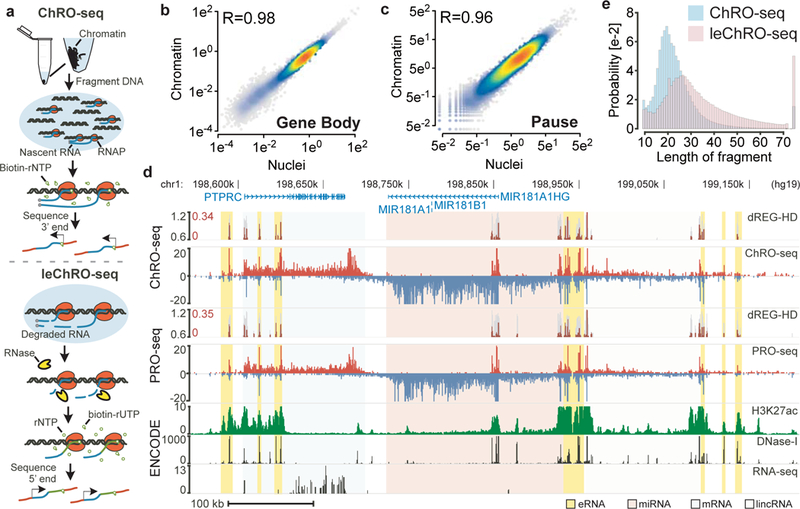
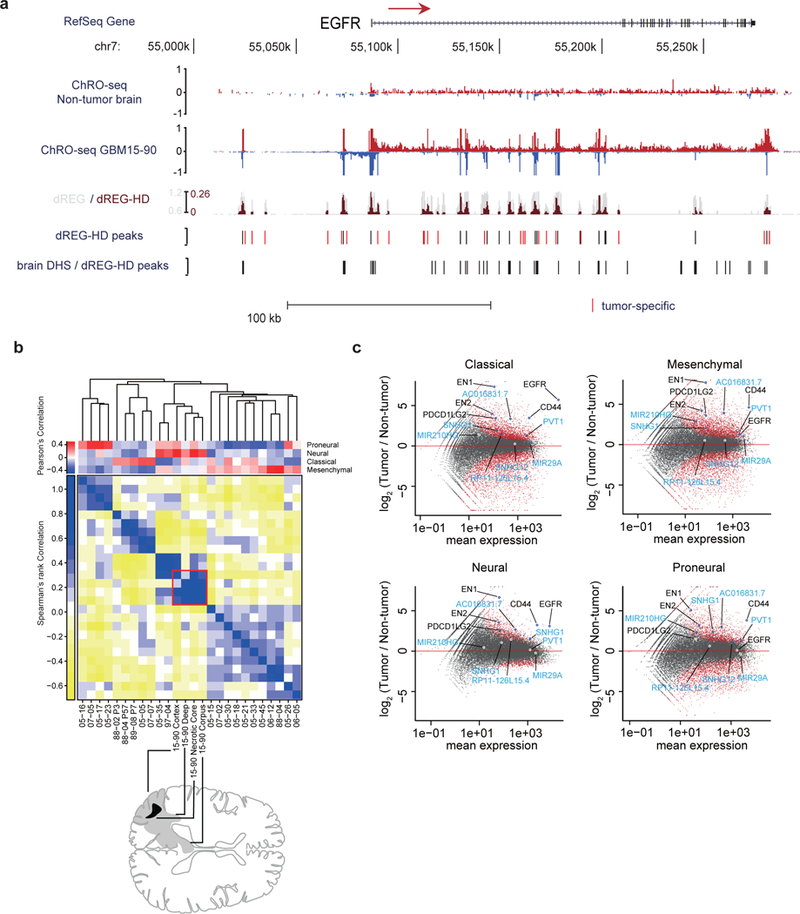
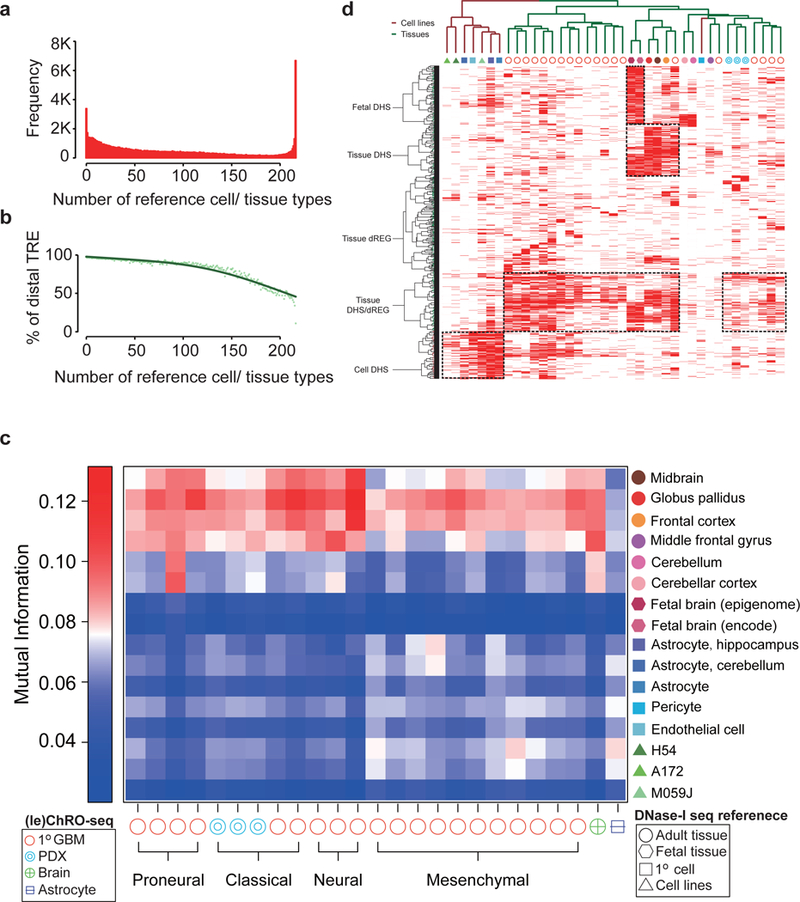
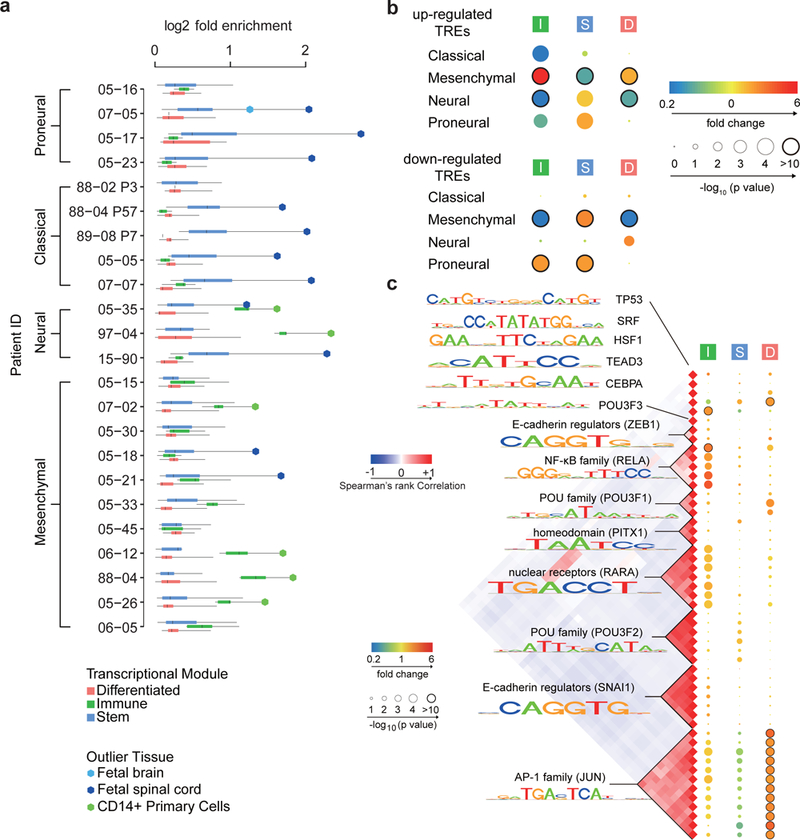
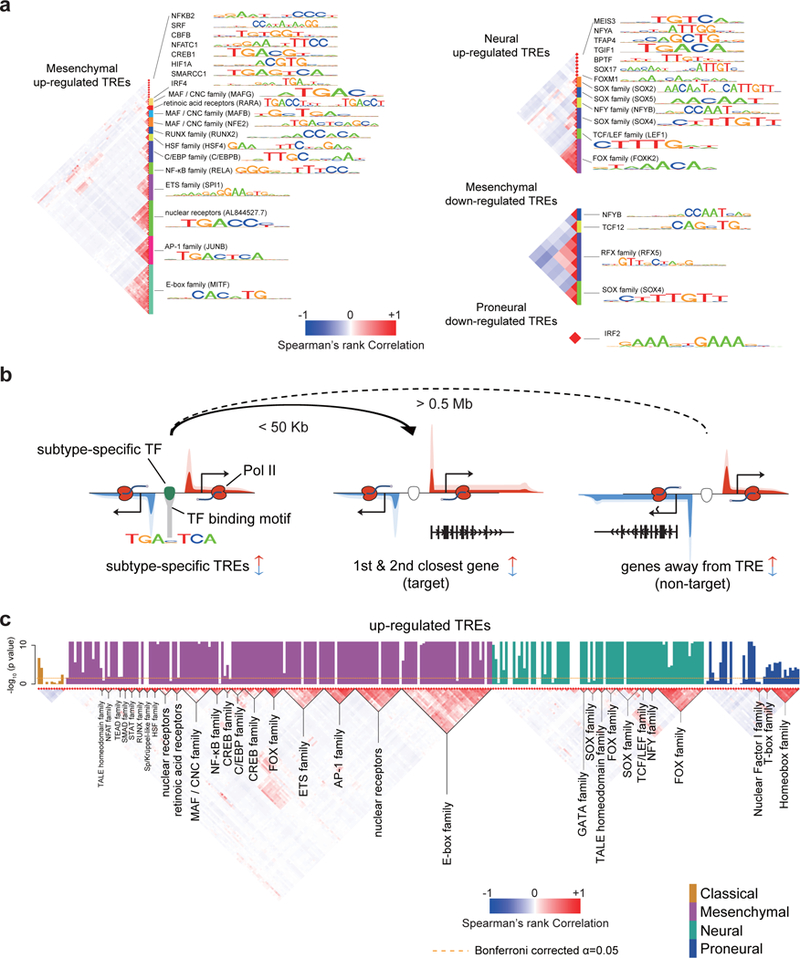
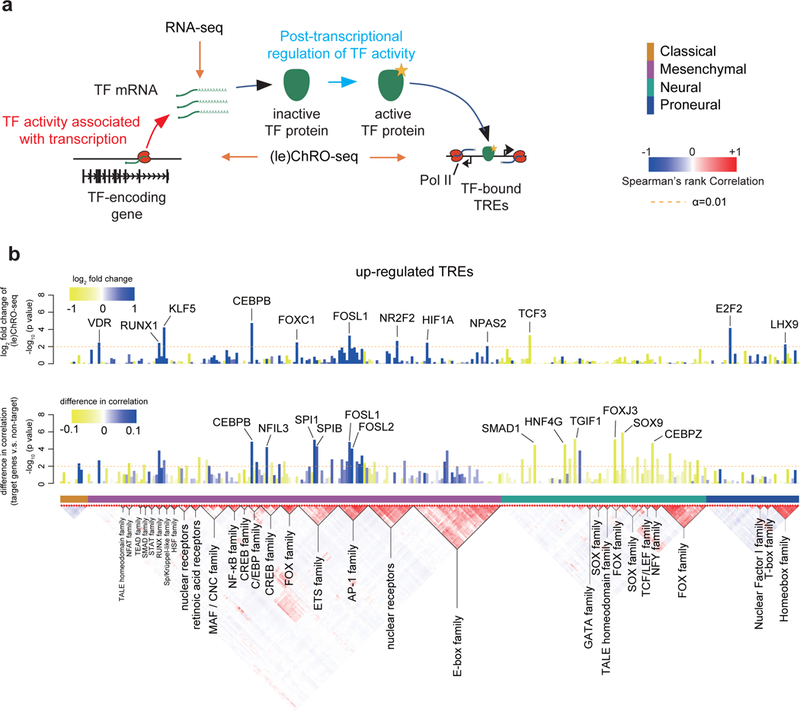
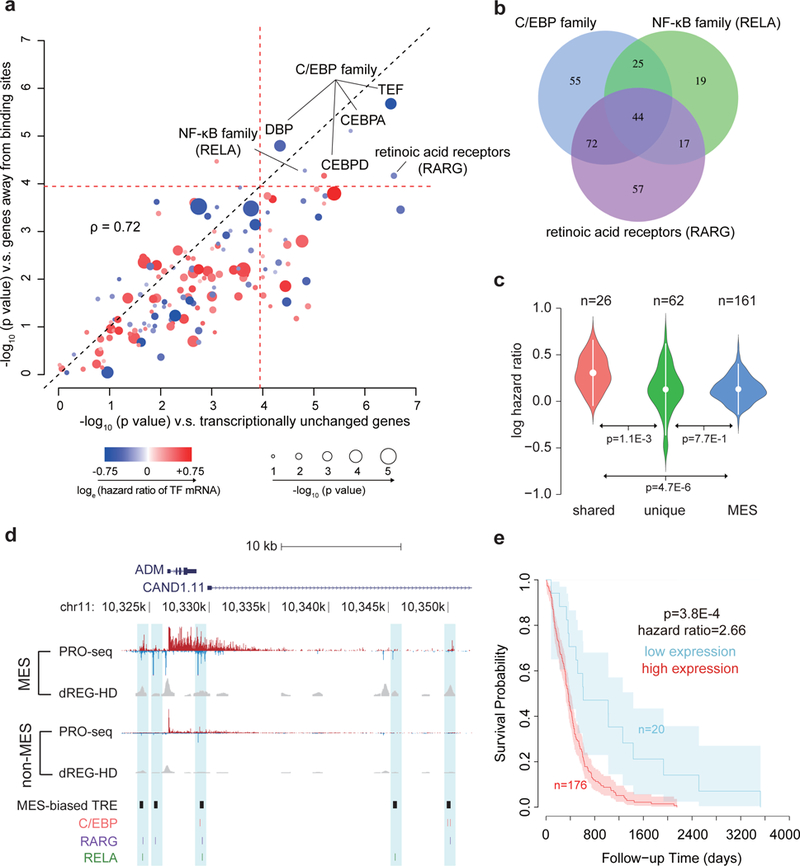
The human genome encodes a variety of poorly understood RNA species that remain challenging to identify using existing genomic tools. We developed chromatin run-on and sequencing (ChRO-seq) to map the location of RNA polymerase for almost any input sample, including samples with degraded RNA that are intractable to RNA sequencing. We used ChRO-seq to map nascent transcription in primary human glioblastoma (GBM) brain tumors. Enhancers identified in primary GBMs resemble open chromatin in the normal human brain. Rare enhancers that are activated in malignant tissue drive regulatory programs similar to the developing nervous system. We identified enhancers that regulate groups of genes that are characteristic of each known GBM subtype and transcription factors that drive them. Finally we discovered a core group of transcription factors that control the expression of genes associated with clinical outcomes. This study characterizes the transcriptional landscape of GBM and introduces ChRO-seq as a method to map regulatory programs that contribute to complex diseases.


Conflict of interest statement

Competing financial interests:

The authors declare no competing financial interests.

Figures

Fig. 1.
Fig. 1.. ChRO-seq and leChRO-seq measure primary transcription in isolated chromatin.
(a) Isolated chromatin is resuspended into solution, incubated with biotinylated rNTPs, purified by streptavidin beads, and sequenced from the 3’ end. leChRO-seq degrades existing RNA, extends nascent transcripts an average of 100 bp, and sequences RNAs from the 5’ end. (b and c) Comparison between matched ChRO-seq and PRO-seq in 41,478 RefSeq annotated gene bodies (b) or at the peak of paused Pol II (c). (d) Comparison between ChRO-seq (top three tracks), PRO-seq (center), and H3K27ac ChIP-seq, DNase-I-seq, and RNA-seq (bottom). dREG-HD shows the raw signal for dREG (gray) and dREG-HD signal (dark red). The shaded background shows the type of RNA produced at each position (e) The distribution of read lengths from ChRO-seq (blue) and leChRO-seq (pink) in a 30 year old primary GBM.
Fig. 2.
Fig. 2.. ChRO-seq detects transcription in primary human glioblastomas.
(a) RPM normalized ChRO-seq signal at the EGFR locus in nonmalignant brain (top) and GBM-15–90 (center). dREG (gray) and dREG-HD (dark red) signals are shown for GBM-15–90. dREG-HD peaks that are not DHSs in adult brain reference samples are highlighted in red. DHSs in 6 adult brain reference samples and dREG-HD peaks from the non-malignant brain sample. (b) Upper matrix: subtype scores for each patient, calculated by Pearson’s correlation with the centroid of gene expression of corresponding subtype. Lower matrix: Spearman’s rank correlation over subtype signature genes among 20 primary GBMs. Red square denotes four regions dissected from GBM-15–90. Sample order is based on single-link hierarchical clustering of the lower matrix, shown by the dendrogram. In total, 838 genes were used for calculating the correlation coefficients. (c) Differential gene transcription of primary GBMs in each subtype compared with non-malignant brain. Genes of interest are highlighted. lncRNAs are highlighted in blue.
Fig. 3.
Fig. 3.. Comparison between TREs in primary GBM / PDX and reference DHSs.
(a) Histogram representing the number of reference samples that have a DHS overlapping each dREG-HD site found in any of the 23 primary GBM / PDX samples. (b) Percentage of TREs >1kb from the nearest GENCODE transcription start site. (c) Mutual information between TREs in the indicated GBM and reference sample. (d) Clustering of reference samples with primary GBM / PDX based on the activation of TREs. Activate TREs are marked in red; inactive ones are in white.
Fig. 4.
Fig. 4.. Tumor associated TREs (taTREs) activate three regulatory programs.
(a) Boxplots show the log2 fold enrichment of reference tissues enriched in the corresponding GBM. Reference samples enriched in each patient were grouped into three regulatory programs, called stem (blue, n= 24), immune (green, n= 5), and differentiated (pink, n= 21). Box plots show the 25th percentile (bottom of box), median (central bar), and 75th percentile (top of box). Whiskers represent minimum and maximum values. Outlier tissues are indicated in the legend. (b) The radius of the circle represents the p value (two-sided Fisher’s exact test) of enrichment of the indicated regulatory programs in subtype-biased TREs. The color represents the magnitude of enrichment (red) or depletion (blue). Number of subtype-biased TREs in each comparison (panels b and c) is shown in Supplementary Table 3 and 4. (c) Transcription factor binding motifs enriched in TREs of the immune (I), stem (S), and differentiated (D) regulatory program compared with TREs active in the normal brain. All motifs shown were significantly enriched following Bonferroni adjustment of the threshold p value in at least one patient (p < 0.05 / 1882, two-sided Fisher’s exact test). The Spearman’s rank correlation heatmap (left) shows the correlation in DNA binding sites matching each motif. The radius of the circle represents the median p value across patients is and the color represents the magnitude of enrichment (red) or depletion (blue).
Fig. 5.
Fig. 5.. Transcription factors influencing transcriptional heterogeneity in GBM.
(a) Transcription factor binding motifs enriched in TREs that were up- or down-regulated in the indicated subtype. All motifs shown were significantly enriched following Bonferroni adjustment of the threshold p value (p < 0.05 / 1882, two-sided Fisher’s exact test; sample size shown in Supplementary Table 4). The Spearman’s rank correlation heatmap (left) shows the correlation in motif recognition. Families of transcription factors and their representative motifs are highlighted. (b) Cartoon illustrating heuristics used to identify target genes of subtype-specific transcription factor and for defining non-target (control) genes. Changes in transcription of both target and non-target genes are of the same direction as that of subtype-biased TREs. Target genes are the 1st and 2nd genes within 50 Kb of the TRE. Non-target genes are at least 0.5 Mb away. (c) Barplots show the -log10 Wilcoxon rank sum p value of having higher correlations among target genes of each transcription factor binding motif than a control set (columns; N=174 TCGA patients with RNA-seq data available). Barplots are colored by subtype in which they were found to be enriched (p < 0.05, two-sided Fisher’s exact test). The Spearman’s rank correlation between the binding sites of each motif is shown (bottom). Transcription factor families are indicated below the plot. The dotted line shows the Bonferroni adjusted threshold for the between-target validation experiment.
Fig. 6.
Fig. 6.. Regulatory activities of transcription factors are controlled by transcription and post-transcriptional mechanisms in GBM.
(a) The cartoon illustrates the stages at which transcription factor activities can be regulated and the corresponding signals detected by RNA-seq and (le)ChRO-seq. The activity of some transcription factors correlates predominantly with the abundance of its protein. Many transcription factors require post-transcriptional activation of the protein product before regulating target genes. (b) Barplot shows the FDR corrected -log10 p value (DESeq2, Wald test, n= 2 [classical] or 3 [other subtypes]) representing changes in Pol II abundance detected by (le)ChRO-seq on the gene encoding the indicated transcription factor. The level of upregulation (blue) and downregulation (yellow) in the subtype indicated by the colored boxes (below the barplot) is shown by the color scale. The dashed line shows the the FDR corrected α at 0.01. (c) Barplot shows the -log10 two-sided Wilcoxon rank sum test p value denoting differences in the distribution of correlations between the mRNA encoding the indicated transcription factor and either target or non-target control genes. The blue/ yellow color scale represents the median difference in correlation between target and non-target genes over 174 mRNA-seq samples. The dashed line shows the uncorrected α at 0.01.
Fig. 7.
Fig. 7.. Transcription factors control survival associated pathways in GBM.
(a) Scatter plot shows the -log10 two-sided Wilcoxon rank sum test p value comparing the distribution of hazards ratios of target genes for each transcription factor and two groups of non-target control genes (see Online Methods). The radius of the circle denotes the -log10 p value of association between transcription factor mRNA levels and survival. Color denotes the loge of the hazard ratio at higher mRNA levels. The dotted red line represents the Bonferroni adjusted α threshold (0.05/ 432). (b) Venn diagram shows overlap between the target genes of the three indicated transcription factors. (c) Violin plot shows the loge hazard ratios for target genes shared among (left, N=26) and unique to (center, N=62) three transcription factors, and for mesenchymal marker genes (right, N=161). Mean hazard ratios are shown by white dots and standard deviations are shown by bars. P values were calculated by a two-sided Wilcoxon rank sum test. (d) Browser track of ADM shows the average of RPM normalized (le)ChRO-seq signals and dREG-HD scores in mesenchymal (MES, n= 3) and non-MES (n= 8) GBMs. MES-biased TREs and motif positions are highlighted in blue. (e) Kaplan–Meier plot shows overall survival between 196 patients with high and low average expression level of 26 shared target genes. The cutoff was determined based on the minimum p value in the difference between survival time using a two-sided Chi-squared test. Shaded regions mark the 95% confidence interval.

References

    1. Cheng J et al. Transcriptional maps of 10 human chromosomes at 5-nucleotide resolution. Science 308, 1149–1154 (2005). - PubMed
    1. Kim T-K et al. Widespread transcription at neuronal activity-regulated enhancers. Nature 465, 182–187 (2010). - PMC - PubMed
    1. Ulitsky I & Bartel DP lincRNAs: genomics, evolution, and mechanisms. Cell 154, 26–46 (2013). - PMC - PubMed
    1. Quinodoz S & Guttman M Long noncoding RNAs: an emerging link between gene regulation and nuclear organization. Trends Cell Biol. 24, 651–663 (2014). - PMC - PubMed
    1. De Santa F et al. A large fraction of extragenic RNA pol II transcription sites overlap enhancers. PLoS Biol. 8, e1000384 (2010). - PMC - PubMed

References (Online Methods):

    1. Canute GW et al. Hydroxyurea accelerates the loss of epidermal growth factor receptor genes amplified as double-minute chromosomes in human glioblastoma multiforme. Neurosurgery 39, 976–983 (1996). - PubMed
    1. Eller JL, Longo SL, Hicklin DJ & Canute GW Activity of anti-epidermal growth factor receptor monoclonal antibody C225 against glioblastoma multiforme. Neurosurgery 51, 1005–13; discussion 1013–4 (2002). - PubMed
    1. Schmieder R & Edwards R Quality control and preprocessing of metagenomic datasets. Bioinformatics 27, 863–864 (2011). - PMC - PubMed
    1. Martin M Cutadapt removes adapter sequences from high-throughput sequencing reads. EMBnet.journal 17, 10–12 (2011).
    1. Li H & Durbin R Fast and accurate short read alignment with Burrows-Wheeler transform. Bioinformatics 25, 1754–1760 (2009). - PMC - PubMed

Publication types

MeSH terms