. 2018 Nov;50(11):1593-1599.
doi: 10.1038/s41588-018-0248-z. Epub 2018 Oct 22.

An atlas of genetic associations in UK Biobank

Affiliations

An atlas of genetic associations in UK Biobank

Oriol Canela-Xandri et al. Nat Genet. 2018 Nov.

Abstract

Genome-wide association studies (GWAS) have identified many loci contributing to variation in complex traits, yet the majority of loci that contribute to the heritability of complex traits remain elusive. Large study populations with sufficient statistical power are required to detect the small effect sizes of the yet unidentified genetic variants. However, the analysis of huge cohorts, like UK Biobank, is challenging. Here, we present an atlas of genetic associations for 118 non-binary and 660 binary traits of 452,264 UK Biobank participants of European ancestry. Results are compiled in a publicly accessible database that allows querying genome-wide association results for 9,113,133 genetic variants, as well as downloading GWAS summary statistics for over 30 million imputed genetic variants (>23 billion phenotype-genotype pairs). Our atlas of associations (GeneATLAS, http://geneatlas.roslin.ed.ac.uk ) will help researchers to query UK Biobank results in an easy and uniform way without the need to incur high computational costs.


Conflict of interest statement

Competing Interest Statement

The authors declare no competing financial interests.

Figures

Figure 1
Figure 1. The effect of sample size on the number of GWAS hits and their estimated effects.
(a) Comparison between the p-values (two-sided t-test) obtained using the whole cohort (452,264 individuals) and random subsamples of increasing sizes. The plot shows only the results for the genetic variants associated with a p-value < 10-8 in the whole cohort. (b) Total number of detected associated variants (two-sided t-test) at a threshold of p-value < 10-8 as a function of the sample size. (c) Slope of the effect sizes of the GWAS hits obtained in random subsamples of increasing size vs the same effect sizes estimated in the whole cohort. Slopes larger than one indicate an inflation on the effect estimates in the smaller sample. The black line joints the mean at each sample size shown. Error bars indicate the standard deviation.
Figure 2
Figure 2. Histograms of numbers of significant associations (two-sided t-test, P < 10-8).
The panels show results for each phenotype (left) and independent lead variant (right) for non-binary (top) and binary (bottom) phenotypes.
Figure 3
Figure 3. Number of significant associations (two-sided t-test, P < 10-8).
The panels show the number of significant associations at each tested genetic variant for all traits, non-binary and binary phenotypes. The HLA region (±10Mb) is indicated.
Figure 4
Figure 4. Relationship between estimated SNP heritability and numbers of genome wide significant associations (two-sided t-test, P < 10-8).
HLA and surrounding 10Mb region were excluded for non-binary and binary phenotypes respectively.
Figure 5
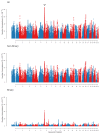
Figure 5. Manhattan plots for selected phenotypes.
Manhattan plots for the phenotypes with the largest number of genome wide significant associations (two-sided t-test, P < 10-8) within each of these categories: non-binary phenotypes, cancer registry, self-reported non-cancer illness, clinically defined disease from hospital episode statistics and matching self-reported disease to the clinically defined disease from hospital episode statistics. From top to bottom: non-binary phenotypes (Standing height), cancer registry (Melanoma and other malignant neoplasms of skin), self-reported non-cancer illness (hypertension), clinically defined malabsorption, and self-reported malabsorption. Genetic variants with P < 10-30 are indicated by marks along the top of each plot.
Figure 6
Figure 6. Numbers of phenotypes of different SNP heritability.
Colours indicate the fraction of phenotypes with heritability significantly (P < 0.05, Chi-squared test, see Online Methods for details) different from zero in each bin.
Figure 7
Figure 7. Phenotypic prediction accuracy from genetic markers.
Accuracy of phenotypic prediction as a function of the estimated SNP-heritability for (a) non-binary traits and (b) binary traits when no covariates were used for prediction. Comparison between prediction accuracy when covariates are included or not included for (c) non-binary traits and (d) binary traits.

References

    1. Falconer DS, Mackay TFC. Introduction to Quantitative Genetics. Longman; 1996.
    1. Sudlow C, et al. UK biobank: an open access resource for identifying the causes of a wide range of complex diseases of middle and old age. PLoS Med. 2015;12:e1001779. - PMC - PubMed
    1. Canela-Xandri O, Law A, Gray A, Woolliams JA, Tenesa A. A new tool called DISSECT for analysing large genomic data sets using a Big Data approach. Nat Commun. 2015;6:10162. - PMC - PubMed
    1. Loh P-R, Kichaev G, Gazal S, Schoech AP, Price AL. Mixed-model association for biobank-scale datasets. Nat Genet. 2018;50:906–908. - PMC - PubMed
    1. McCarthy S, et al. A reference panel of 64,976 haplotypes for genotype imputation. Nat Genet. 2016;48:1279–83. - PMC - PubMed

Publication types