. 2018 Sep 12;10(5):ply052.
doi: 10.1093/aobpla/ply052. eCollection 2018 Oct.

Effects of growth under different light spectra on the subsequent high light tolerance in rose plants

Affiliations

Effects of growth under different light spectra on the subsequent high light tolerance in rose plants

Leyla Bayat et al. AoB Plants. .

Abstract

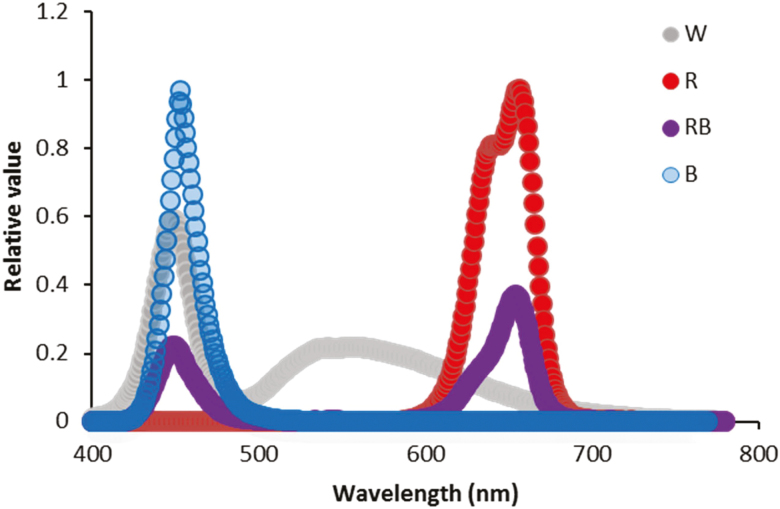
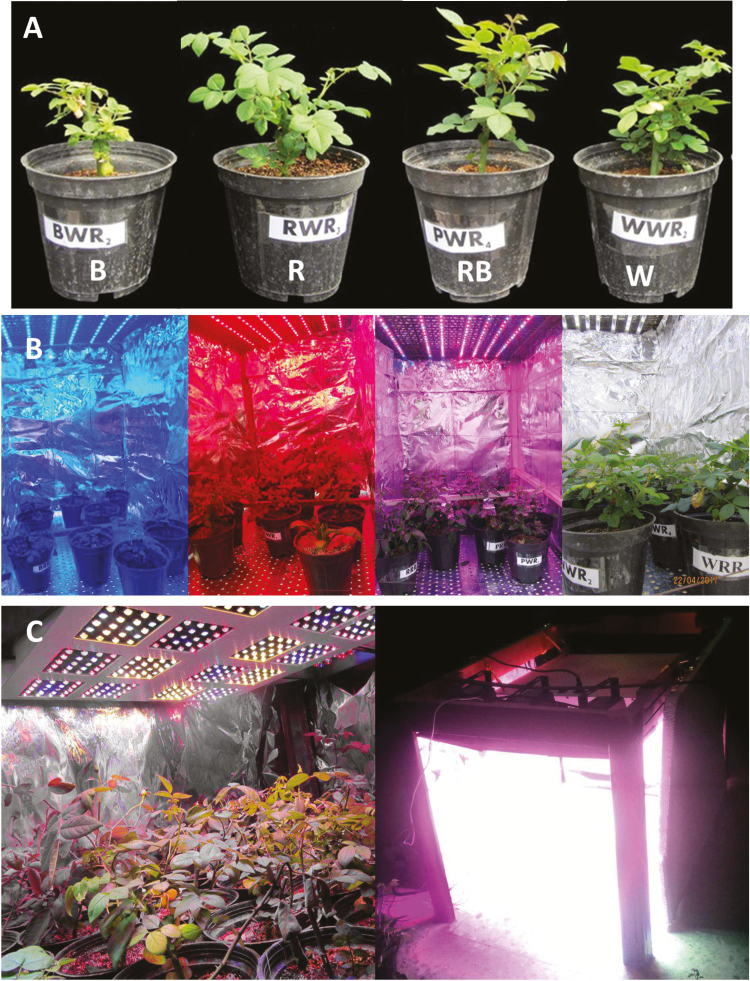
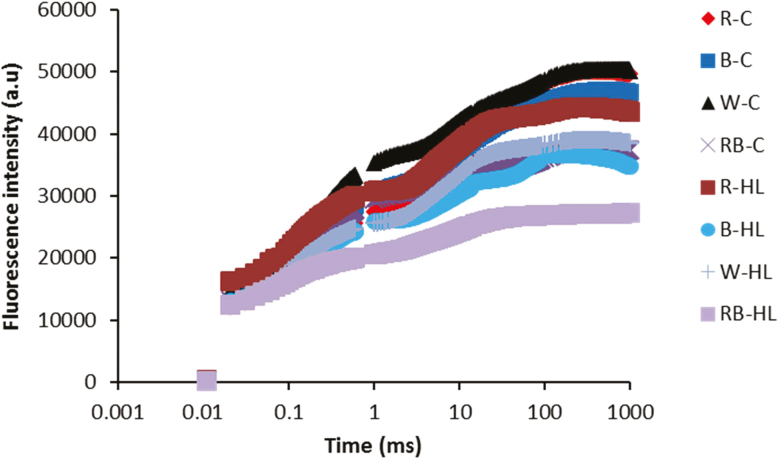
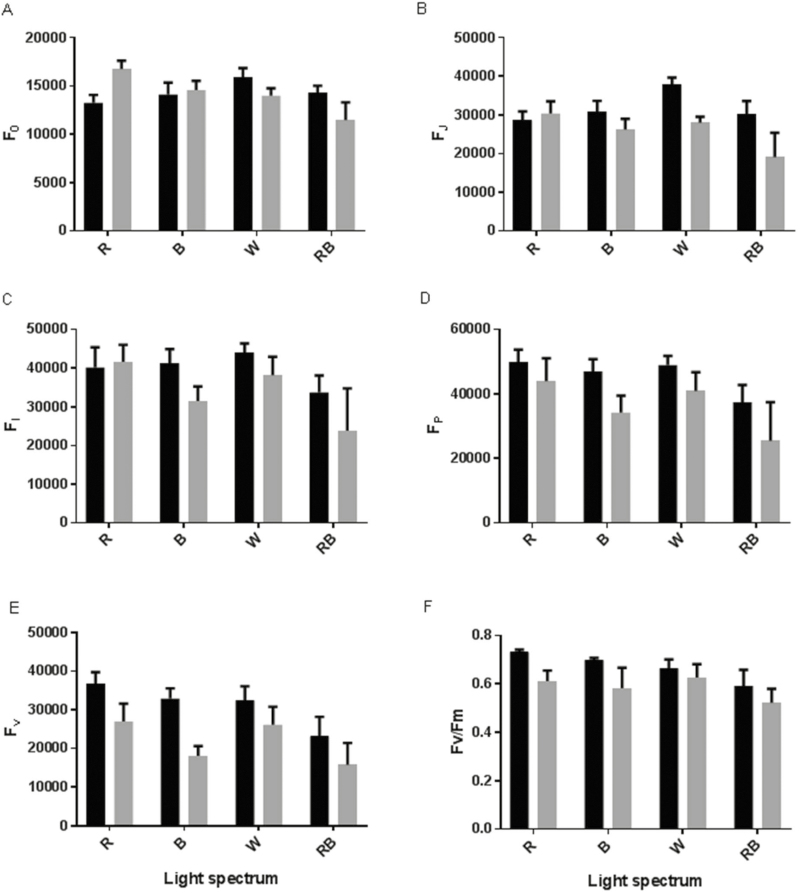
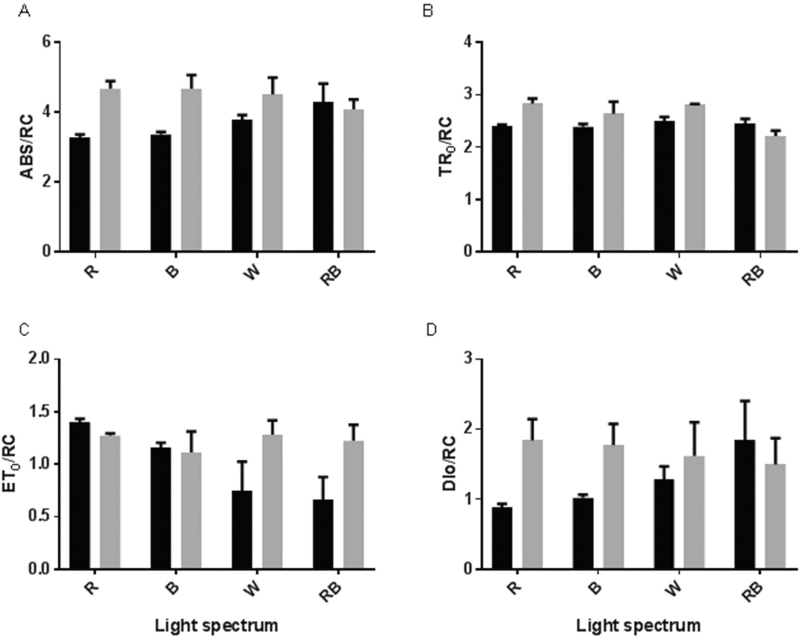
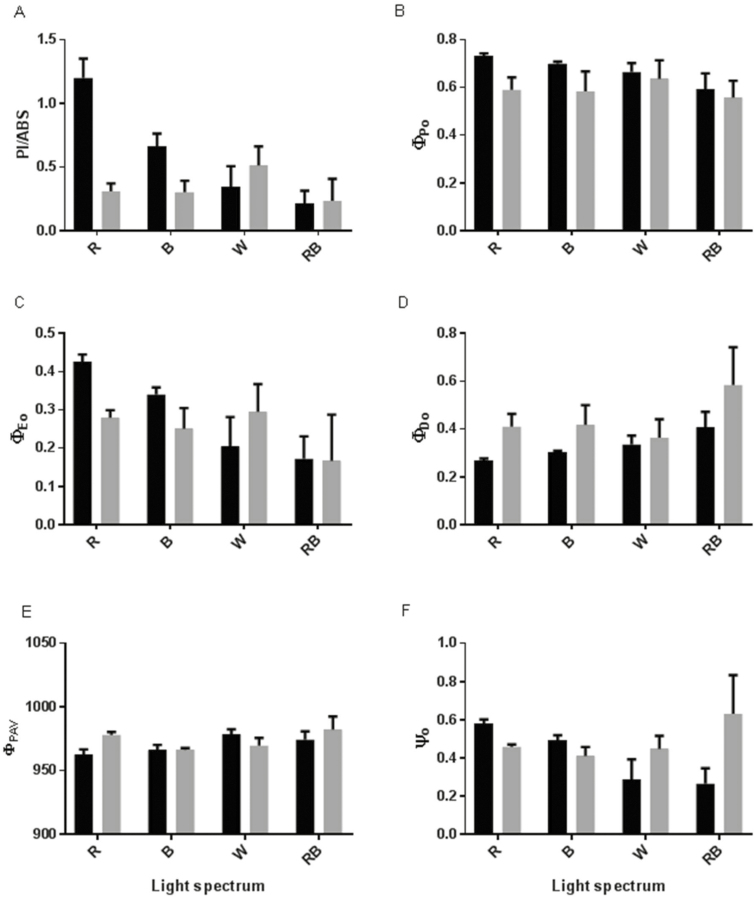
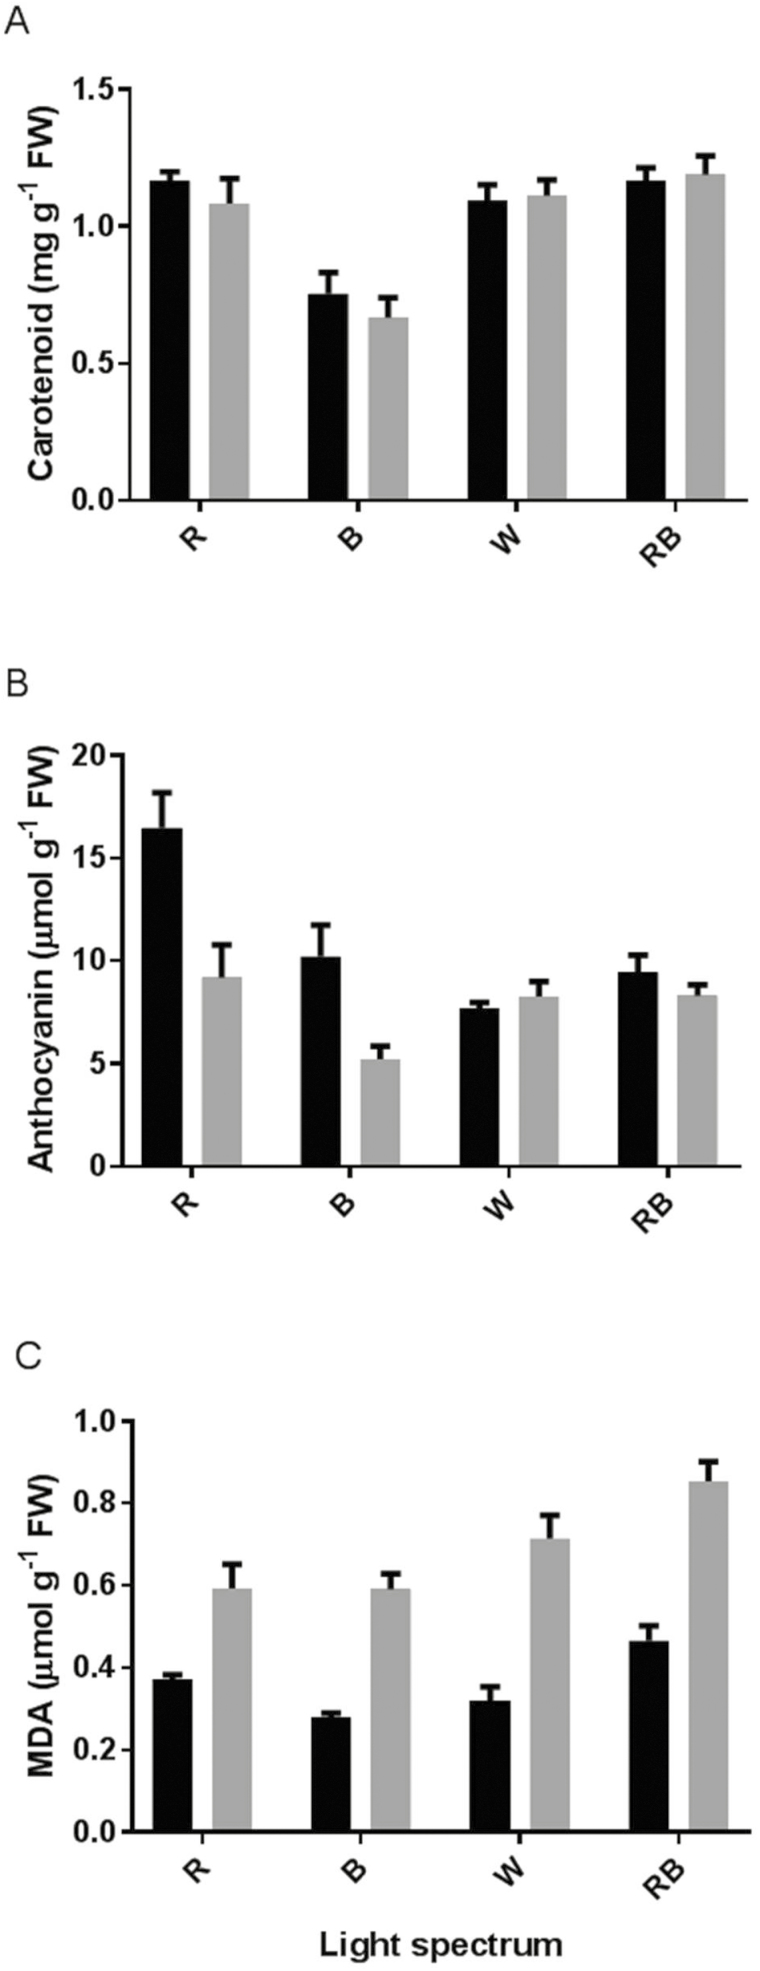
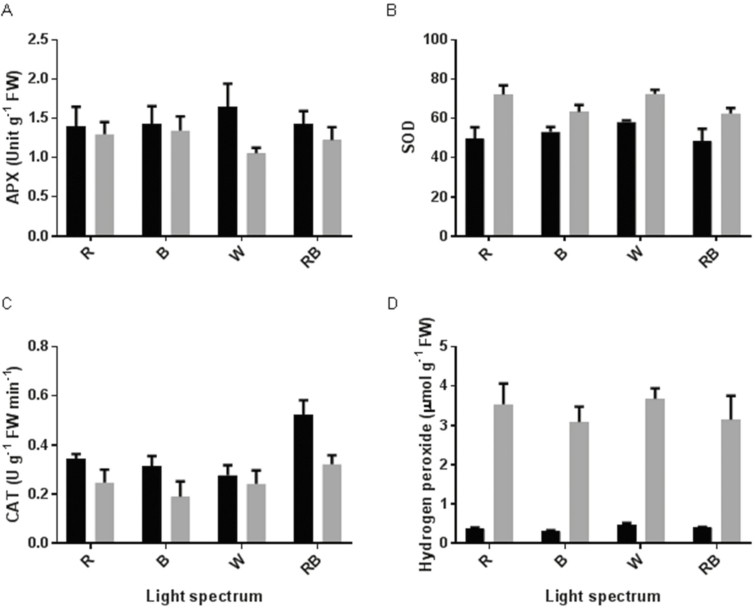
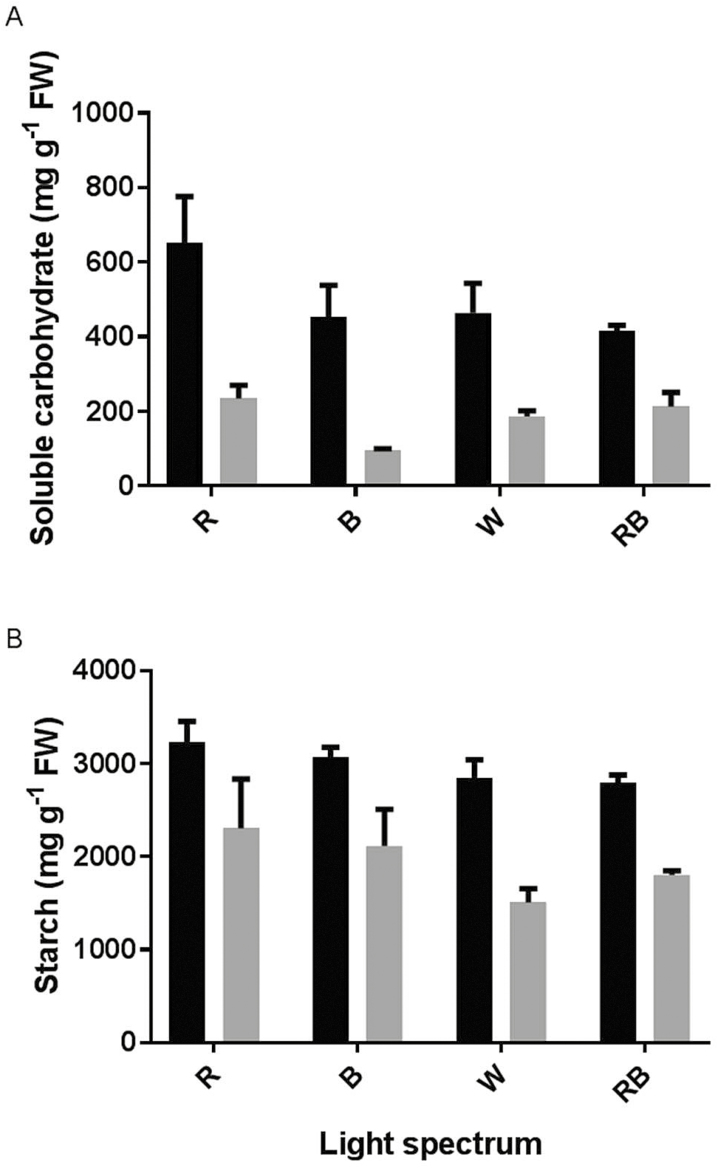
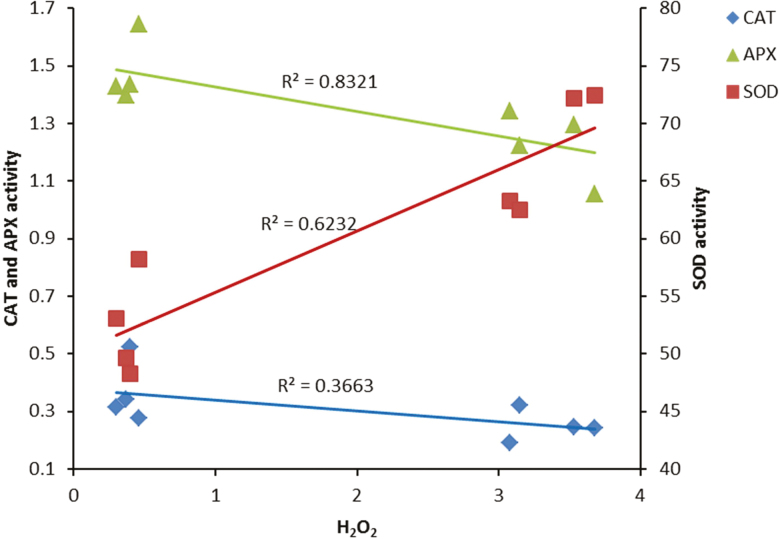
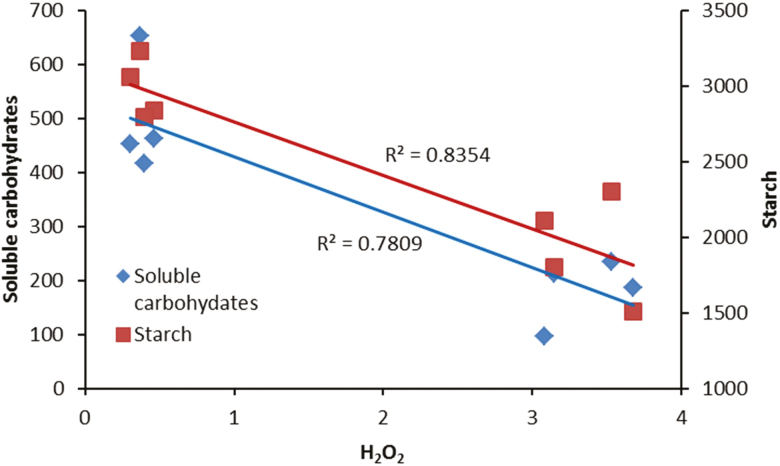
Photosynthesis is defined as a light-dependent process; however, it is negatively influenced by high light (HL) intensities. To investigate whether the memory of growth under monochromatic or combinational lights can influence plant responses to HL, rose plants were grown under different light spectra [including red (R), blue (B), 70:30 % red:blue (RB) and white (W)] and were exposed to HL (1500 μmol m-2 s-1) for 12 h. Polyphasic chlorophyll a fluorescence (OJIP) transients revealed that although monochromatic R- and B-grown plants performed well under control conditions, the functionality of their electron transport system was more sensitive to HL than that of the RB- and W-grown plants. Before exposure to HL, the highest anthocyanin concentration was observed in R- and B-grown plants, while exposure to HL reduced anthocyanin concentration in both R- and B-grown plants. Ascorbate peroxidase and catalase activities decreased, while superoxide dismutase activity was increased after exposure to HL. This caused an increase in H2O2 concentration and malondialdehyde content following HL exposure. Soluble carbohydrates were decreased by exposure to HL, and this decrease was more emphasized in R- and B-grown plants. In conclusion, growing plants under monochromatic light reduced the plants ability to cope with HL stress.

Keywords: Antioxidant enzymes; high light; light spectrum; photosynthesis; pigments.


Figures

Figure 1.
Figure 1.
Light spectra of the blue (B), red (R), red and blue (RB) and white (W) lighting environments measured at plant level in the growth chambers.
Figure 2.
Figure 2.
Representative images showing plants (A) that were grown for 3 weeks under different light spectra [blue (B), red (R), white (W) and red and blue (RB)], growth chambers that were used for growing plants under 250 (B) and 1500 (C) µmol m−2 s−1 PPFD.
Figure 3.
Figure 3.
Fast chlorophyll fluorescence induction curve exhibited by leaves of rose plants exposed to different light spectra [blue (B), red (R), white (W) and red and blue (RB)] under 250 (C) and 1500 (HL) µmol m−2 s−1 PPFD.
Figure 4.
Figure 4.
Intensity of chlorophyll a fluorescence in the OJIP test including F0 (A), FJ (B), FI (C), FP (D), Fv [E; (FmF0)] and Fv/Fm (F) from the fluorescence transient exhibited by leaves of rose plants grown under different light spectra [blue (B), red (R), white (W) and red and blue (RB)] under 250 (black bars) and 1500 (grey bars) µmol m−2 s−1 PPFD. Bars represent means ± SD.
Figure 5.
Figure 5.
Specific energy fluxes per reaction centre (RC) for energy absorption [A; (ABS/RC)], trapped energy flux [B; (TR0/RC)], electron transport flux [C; (ET0/RC)] and dissipated energy flux [D; (DI0/RC)] from the fluorescence transient exhibited by leaves of rose plants grown under different light spectra [blue (B), red (R), white (W) and red and blue (RB)] under 250 (black bars) and 1500 (grey bars) µmol m−2 s−1 PPFD. Bars represent means ± SD.
Figure 6.
Figure 6.
Performance index on the absorption basis [A; (PIABS)], maximum quantum yield of primary photochemistry [B; (φPo)], quantum yield of electron transport [C; (φEo)], quantum yield of energy dissipation [D; (φDo)], average (from time 0 to tFM) quantum yield for primary photochemistry [E; (φPAV)] and the probability that a trapped exciton moves an electron in the electron transport chain beyond QA [F; (ψo)] from the fluorescence transient exhibited by leaves of rose plants grown under different light spectra [blue (B), red (R), white (W) and red and blue (RB)] under 250 (black bars) and 1500 (grey bars) µmol m−2 s−1 PPFD. Bars represent means ± SD.
Figure 7.
Figure 7.
Carotenoid (A) and anthocyanin (B) concentrations and MDA (C) content in the leaves of rose plants grown under different light spectra [blue (B), red (R), white (W) and red and blue (RB)] under 250 (black bars) and 1500 (grey bars) µmol m−2 s−1 PPFD. Bars represent means ± SD.
Figure 8.
Figure 8.
Activity of APX (A), SOD (B) and CAT (C) and H2O2 concentration in the leaves of rose plants grown under different light spectra [blue (B), red (R), white (W) and red and blue (RB)] under 250 (black bars) and 1500 (grey bars) µmol m−2 s−1 PPFD. Bars represent means ± SD.
Figure 9.
Figure 9.
Concentration of soluble carbohydrate (A) and starch (B) in the leaves of rose plants grown under different light spectra [blue (B), red (R), white (W) and red and blue (RB)] under 250 (black bars) and 1500 (grey bars) µmol m−2 s−1 PPFD. Bars represent means ± SD.
Figure 10.
Figure 10.
Relationship between performance index on the absorption basis (PIABS) and concentration of carbohydrates (soluble carbohydrates and starch) in the leaves of rose plants grown under different light spectra [blue (B), red (R), white (W) and red and blue (RB)] under 250 (C) and 1500 (HL) µmol m−2 s−1 PPFD.
Figure 11.
Figure 11.
Relationship between H2O2 concentration and activity of antioxidant enzymes (CAT, APX and SOD) in the leaves of rose plants grown under different light spectra [blue (B), red (R), white (W) and red and blue (RB)] under 250 (C) and 1500 (HL) µmol m−2 s−1 PPFD.
Figure 12.
Figure 12.
Relationship between H2O2 concentration and concentration of carbohydrates (soluble carbohydrates and starch) in the leaves of rose plants grown under different light spectra [blue (B), red (R), white (W) and red and blue (RB)] under 250 (C) and 1500 (HL) µmol m−2 s−1 PPFD.
Figure 13.
Figure 13.
Relationship between performance index on the absorption basis (PIABS) and pigments (anthocyanin and carotenoid) in the leaves of rose plants grown under different light spectra [blue (B), red (R), white (W) and red and blue (RB)] under 250 (C) and 1500 (HL) µmol m−2 s−1 PPFD.

References

    1. Ahmad P, Jaleel CA, Salem MA, Nabi G, Sharma S. 2010. Roles of enzymatic and nonenzymatic antioxidants in plants during abiotic stress. Critical Reviews in Biotechnology 30: 161–175. - PubMed
    1. Aliniaeifard S, Malcolm Matamoros P, van Meeteren U. 2014. Stomatal malfunctioning under low VPD conditions: induced by alterations in stomatal morphology and leaf anatomy or in the ABA signaling?Physiologia Plantarum 152:688–699. - PubMed
    1. Aliniaeifard S, van Meeteren U. 2014. Natural variation in stomatal response to closing stimuli among Arabidopsis thaliana accessions after exposure to low VPD as a tool to recognize the mechanism of disturbed stomatal functioning. Journal of Experimental Botany 65:6529–6542. - PMC - PubMed
    1. Arnon DI. 1949. Copper enzymes in isolated chloroplasts. Polyphenoloxidase in Beta vulgaris. Plant Physiology 24:1–15. - PMC - PubMed
    1. Aro EM, Virgin I, Andersson B. 1993. Photoinhibition of photosystem II. Inactivation, protein damage and turnover. Biochimica et Biophysica Acta (BBA)-Bioenergetics 1143:113–134. - PubMed