

Predicting in-hospital mortality in pneumonia-associated septic shock patients using a classification and regression tree: a nested cohort study
- PMID: 30349726
- PMCID: PMC6186142
- DOI: 10.1186/s40560-018-0335-3
Predicting in-hospital mortality in pneumonia-associated septic shock patients using a classification and regression tree: a nested cohort study
Abstract
Background: Pneumonia complicated by septic shock is associated with significant morbidity and mortality. Classification and regression tree methodology is an intuitive method for predicting clinical outcomes using binary splits. We aimed to improve the prediction of in-hospital mortality in patients with pneumonia and septic shock using decision tree analysis.
Methods: Classification and regression tree models were applied to all patients with pneumonia-associated septic shock in the international, multicenter Cooperative Antimicrobial Therapy of Septic Shock database between 1996 and 2015. The association between clinical factors (time to appropriate antimicrobial therapy, severity of illness) and in-hospital mortality was evaluated. Accuracy in predicting clinical outcomes, sensitivity, specificity, and area under receiver operating curve of the final model was evaluated in training (n = 2111) and testing datasets (n = 2111).
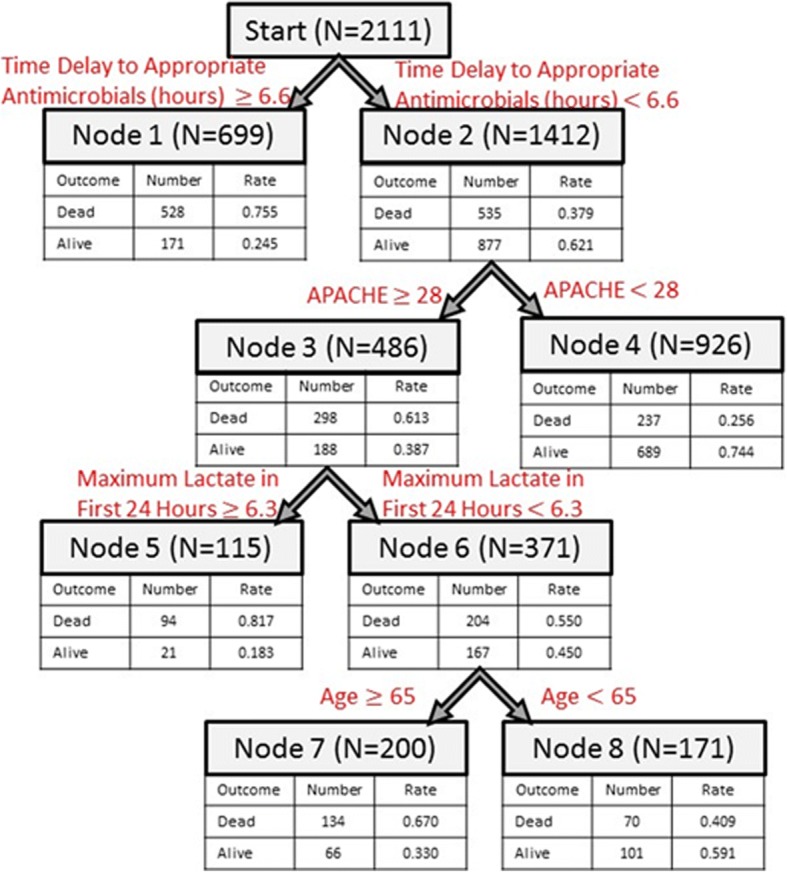
Results: The study cohort contained 4222 patients, and in-hospital mortality was 51%. The mean time from onset of shock to administration of appropriate antimicrobials was significantly higher for patients who died (17.2 h) compared to those who survived (5.0 h). In the training dataset (n = 2111), a tree model using Acute Physiology and Chronic Health Evaluation II Score, lactate, age, and time to appropriate antimicrobial therapy yielded accuracy of 73% and area under the receiver operating curve 0.75. The testing dataset (n = 2111) had accuracy of 69% and area under the receiver operating curve 0.72.
Conclusions: Overall mortality (51%) in patients with pneumonia complicated by septic shock is high. Increased time to administration of antimicrobial therapy, Acute Physiology and Chronic Health Evaluation II Score, serum lactate, and age were associated with increased in-hospital mortality. Classification and regression tree methodology offers a simple prognostic model with good performance in predicting in-hospital mortality.
Keywords: Antimicrobial therapy; Classification and regression tree; Pneumonia; Septic shock.
Conflict of interest statement
Approval was obtained from the Institutional Review Boards of all participating institutions. A waived consent protocol was approved by the health ethics boards of the University of Manitoba and at each individual participating center.Not applicable.The authors declare that they have no competing interests.Springer Nature remains neutral with regard to jurisdictional claims in published maps and institutional affiliations.
Figures
References
-
- Kochanek KD, Murphy SL, Xu J, Tejada-Vera B. Deaths: final data for 2014. National vital statistics reports: from the Centers for Disease Control and Prevention, National Center for Health Statistics. Natl Vital Stat Syst. 2016;65(4):1–122. - PubMed
-
- Rui P, Kang K. National Hospital Ambulatory Medical Care Survey: 2014 emergency department summary tables. Centers for Disease Control and Prevention. 2014.
-
- Pfuntner A, Wier LM, Steiner C. Costs for hospital stays in the United States, 2011: statistical brief# 168. 2006. - PubMed
-
- Breiman L, Friedman JH, Olshen RA, Stone CJ. Classification and regression trees. Monterrey, CA: Wadsworth and Brooks; 1984.
LinkOut - more resources
Full Text Sources
