Review
. 2018 Dec;251(5-6):609-631.
doi: 10.1007/s00232-018-0050-y. Epub 2018 Oct 22.

Understanding Conformational Dynamics of Complex Lipid Mixtures Relevant to Biology

Affiliations
Review

Understanding Conformational Dynamics of Complex Lipid Mixtures Relevant to Biology

Ran Friedman et al. J Membr Biol. 2018 Dec.

Abstract

This is a perspective article entitled "Frontiers in computational biophysics: understanding conformational dynamics of complex lipid mixtures relevant to biology" which is following a CECAM meeting with the same name.

Keywords: Cell membrane; Computational biophysics; Lipid–protein interactions; Molecular dynamics.


Conflict of interest statement

Conflicts of interest

The authors declare no conflict of interest.

Research Involving Human Participants or Animals

This research does not involve human participants or animals.

Figures
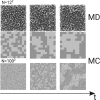
Fig. 1
Fig. 1
Membrane simulations with a lattice model. Time evolution of a DPPC(pink)/DLiPC(cyan)-mixture at T=290 K, based on all-atom MD simulations (with a system size of 122) and MC simulations of the corresponding lattice model (with a system sizes of 122 and 1002). The simulations were started with random distributions of both lipid types. A comparison of the MD and MC simulations revealed a qualitative agreement with respect to the unmixing process (upper and middle frames). Such an agreement was even found on a quantitative level (Hakobyan and Heuer 2017). Importantly, the MC simulations were eight orders of magnitude faster than the MD simulations. Variation of the system size of the lattice model (lower frame) betrayed the impact of finite size effects on the domain formation. Interestingly, for simple DPPC/DLiPC mixtures, it turned out that the initial process of unmixing does not display relevant finite size effects for system sizes larger than 122
Fig. 2
Fig. 2
MARTINI model of PSII embedded in the thylakoid membrane. The PSII dimer is shown with different colours for its subunits. Chlorophylls are depicted in green, β-carotenes in dark orange, haems in red and the exchanging PLQ electron carriers in orange. The thylakoid lipids are shown with white tails and grey heads. Water is rendered as blue translucent surface
Fig. 3
Fig. 3
Simulations of lipid droplets with a coarse-grained model. Screenshots from MD simulations of a lipid bilayer (a) and of trilayers mimicking the lipid droplet structure with different amounts of oil (b, c) are shown as discussed in (Bacle et al. 2017). Water is coloured in blue, PLs in orange and TG in yellow. The beads that correspond to the phosphate group are highlighted in red. The CG lipid model by Klein and coworkers was used, and all the simulations were performed using the software LAMMPS (Plimpton 1995). All the systems are constituted by 800 POPC molecules with 816 TG molecules in system (b) and 2448 TG in system (c). System (a) and (b) contain 15400 water molecules and system (c) 27000. All the simulations were run for 500 ns
Fig. 4
Fig. 4
Block-copolymer nanoparticles. Representative snapshot for the simulated: a F127 micelle and b L121 polymersome. PPO and PEO bead are coloured red and green, respectively. PW waters are coloured blue. CG simulations of up to 1.5 μs were performed using GROMACS 4.5 (Berendsen et al. ; van der Spoel et al. 2005) as detailed in (Wood et al. 2018)
Fig. 5
Fig. 5
Curved bilayer structures. a A buckled bilayer containing different lipid species. Buckled bilayers were simulated in GROMACS 5 with the MARTINI 2.2 Forcefield at 303 K. Buckled bilayers were generated by applying lateral pressure along the long dimension of the bilayer. From the buckling trajectories snapshot at fixed lateral strains was extracted and run with constant number of particles, volume and temperature (NVT) for 36 μs to allow for lipid species partitioning in curvature space. b A ring torus with a wedge removed to show the inner surface. This shape was generated using the tool BUMPy from a flat MARTINI model bilayer
Fig. 6
Fig. 6
Registration of lipid domains. Ordered domains (green lipids) from the two leaflets are always in register. The alignment is driven by both (i) the line tension around ordered domains and (ii) membrane undulations. The line tension occurs as a result of hydrophobic mismatch between the lipids in the thicker (bilayer thickness ho) ordered domain and the lipids in the thinner (bilayer thickness hd) disordered domain (orange). It induces elastic deformations of the lipid molecules adjacent to the border of both phases that minimise the access of water to the hydrophobic acyl chains. A stepwise transition from ho to hd reduces the energetic costs for the shape changes of the lipids. It is realised by spatially separating the height changes in the two leaflets from each other, i.e., by introducing a small shift L between the edges of the ordered domains in the two leaflets (Galimzyanov et al. 2015). The wavelength of membrane undulations depends on the local resistance to lipid deformation. Owing to their smaller splay modulus, disordered lipids populate areas with larger monolayer curvature (R1). In contrast, stiffer ordered domains localise to areas with lower curvature (R2), which naturally coincide with the opposing monolayers (Galimzyanov et al. 2017)
Fig. 7
Fig. 7
Hydrogen-bonding water bridges between lipid phosphate groups. The data are from a simulation of a membrane composed of 4:1 POPC/POPG lipids (Karathanou and Bondar 2018). a Illustration of the algorithm used to identify unique water bridges of the shortest distance between two lipid phosphate groups; green lines indicate the shortest hydrogen bond network found for the configuration used. The maximum number of waters allowed in a hydrogen-bonded chain is 5. b Topology analysis of one-water bridges path length interconnecting phosphate groups in the upper membrane leaflet. The visualisation is based on the coordinates of atoms from a simulation snapshot. The dots indicate phosphorus atoms and are coloured as grey, green, red, yellow, magenta, and cyan according to the path length L of water-mediated bridges in which they engage. L can have the following values: 0 (no bridge), 1, 2, 3, 4, or 5. For simplicity, only linear paths are considered, whereas cyclic paths are excluded from the search. If L>3 and cycles are part of a larger path, all possible linear path lengths are computed and the one with the longest length is derived as a result. The image was generated with MATLAB R2017b (The MathWorks, Inc. 2017). Molecular visualisations were prepared with VMD (Humphrey et al. 1996)
Fig. 8
Fig. 8
Representation of ibuprofen embedded in a hydrated lipid bilayer system and at two different depths. Two different conformations for the carboxyl acid of ibuprofen have been described (cis and trans), depending on the position relative to the bilayers normal. In this illustration, ibuprofen is depicted while it is a in the polar region of the bilayer; and b in the centre of the bilayer. The employed set of charges has an impact on the distribution of the dihedral angle of the carboxyl group of ibuprofen, along the membrane normal and thus on the free energy profile for membrane crossing (Coimbra et al. 2017). An accurate portrayal of this distribution is essential for the correct description of its permeation process. In this figure, the membrane and ibuprofen are represented as sticks, while water molecules, phosphorus and nitrogen atoms are represented as spheres. (Phosphorus and nitrogen spheres have been enlarged for illustration purposes.) The following colour scheme was employed: C, white (membrane) or green (ibuprofen); N, blue; P, gold; O, red; and H, white
Fig. 9
Fig. 9
Membranes are directly involved in mechano-sensing. a Membranes propagate mechanical force, be it a shearing, stretching, or compressive force, vertical or orthogonal to the membrane, onto protein mechano-sensors such as membrane channels, receptors, or membrane-anchored proteins. b Focal adhesion kinase attached to the membrane through PIP2 is activated by mechanical force, as suggested by MD simulations (Zhou et al. 2015). c Pressure pulses travel through lipid bilayers over many tens of nanometers at the speed of sound (Aponte-Santamaría et al. 2017)
Fig. 10
Fig. 10
H. influenzae GlpG in a hydrated lipid membrane environment. a View from the periplasmic side showing selected protein groups and lipid molecules. The catalytic S116 and H169 are depicted as black van der Waals spheres; selected Asp/Glu and Arg/Lys sidechains are coloured red and blue, respectively. Lipid molecules whose headgroups are within hydrogen bond distance of the carboxylate, lysine and arginine sidechains shown are coloured green, other lipid molecules are in grey. Water molecules at the cytoplasmic side of the membrane are coloured pink. b Side view of H. influenzae GlpG in POPE, showing that lipid alkyl chains can intercalate in the interhelical space. Molecular graphics were prepared with VMD (Humphrey et al. 1996)
Fig. 11
Fig. 11
Modulation of membrane thickness around a transmembrane receptor. Two-dimensional membrane thickness profiles around the ErbB2 growth factor receptor transmembrane domain, calculated as described in (Prasanna et al. 2013). The membrane thickness corresponds to the transmembrane dimer (left panel) and the two spatially separated monomers (right column) of a, b wild-type ErbB2 and c, d the V659E/V664E associative mutant. The green/yellow stretches correspond to the bulk membrane thickness, and the blue stretches correspond to membrane perturbations resulting in decreased membrane thickness
Fig. 12
Fig. 12
Evolutionary relationships of full and transmembrane-only proteomes. a Evolutionary relationships of proteomes. Eukarya are shown in green, bacteria in black and archaea in red. b Evolutionary relationships of TMP. Thermophiles are shown in purple. The data are from Piotto et al.
Fig. 13
Fig. 13
Two examples of systems where lipids affect the dynamics of peptides. a Two IAPP dimers formed on a lipid membrane (not shown) in atomistic MD simulation. The peptides are coloured according to secondary structures with coils or turns in grey, β-strands in blue, and helices in green. b Cholesterol occupancy maps. Overlay of cholesterol occupancies as extracted from the three MAT CG simulations: the human dopamine transporter (violet), the human serotonin transporter (cyan) and the human norepinephrine transporter (green). The two co-crystallised cholesterol molecules revealed in dDAT crystal structures are highlighted in orange licorice

Similar articles

Cited by

References

    1. Aponte-Santamaría C, Brunken J, Gräter F. Stress propagation through biological lipid bilayers in silico. J Am Chem Soc. 2017;139:13,588–13,591. doi: 10.1021/jacs.7b04724. - DOI - PubMed
    1. Arutyunova E, Panwar P, Skiba PM, Gale N, Mak MW, Lemieux MJ. Allosteric regulation of rhomboid intramembrane proteolysis. EMBO J. 2014;33(17):1869–1881. - PMC - PubMed
    1. Atilla-Gokcumen GE, Muro E, Relat-Goberna J, Sasse S, Bedigian A, Coughlin ML, Garcia-Manyes S, Eggert US. Dividing cells regulate their lipid composition and localization. Cell. 2014;156:428–439. doi: 10.1016/j.cell.2013.12.015. - DOI - PMC - PubMed
    1. Bacle A, Gautier R, Jackson CL, Fuchs PFJ, Vanni S. Interdigitation between triglycerides and lipids modulates surface properties of lipid droplets. Biophys J. 2017;112(7):1417–1430. - PMC - PubMed
    1. Beevers AJ, Kukol A. The transmembrane domain of the oncogenic mutant erbb-2 receptor: a structure obtained from site-specific infrared dichroism and molecular dynamics. J Mol Biol. 2006;361:945–953. - PubMed

Publication types