

doi: 10.1007/s11538-018-0526-z.
Epub 2018 Oct 22.
Variability of Betweenness Centrality and Its Effect on Identifying Essential Genes
Affiliations
- PMID: 30350013
- PMCID: PMC6476710
- DOI: 10.1007/s11538-018-0526-z
Item in Clipboard
Variability of Betweenness Centrality and Its Effect on Identifying Essential Genes
Bull Math Biol.
2019 Sep.
Abstract
This paper begins to build a theoretical framework that would enable the pharmaceutical industry to use network complexity measures as a way to identify drug targets. The variability of a betweenness measure for a network node is examined through different methods of network perturbation. Our results indicate a robustness of betweenness centrality in the identification of target genes.
Keywords: Betweenness centrality; Differential expression; Network complexity measure.
Figures

A heat map showing gene expression data from 30 tissue samples. The 16 samples on the left are from healthy tissue; the 14 samples on the right are from tumor samples. Each horizontal row is one gene, and the columns are different samples. Colors show expression levels. In this study, we sought to define differences between neoplastic and non-neoplastic groups. Specifically, we were interested in answering this question in the context of changes in the network that represent the interactions between genes. In other words, how can we identify the genes that play important roles in these network changes? Data are from the publicly available NCBI GEO repository, GSE42656.
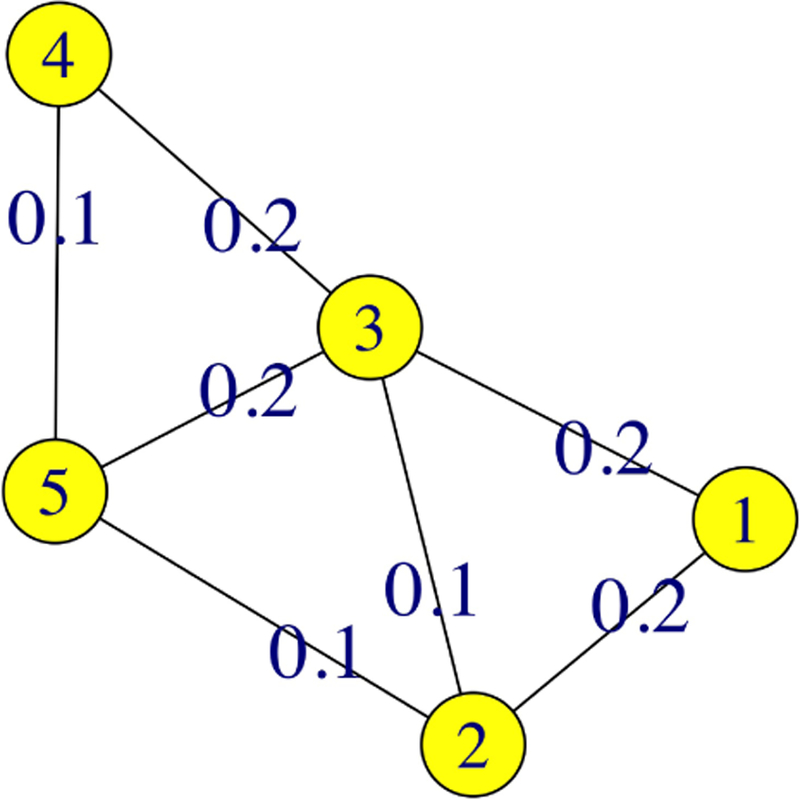
A weighted sample network with nodes V = {1, 2, 3, 4, 5} and edges E = {e1,2, e1,3, e2,3, e2,5, e3,4, e3,5, e4,5} with corresponding edge-weights {0.2, 0.2, 0.1, 0.1, 0.2, 0.2, 0.1}.

Two structurally identical weighted networks, true (left) and observed (right), with nodes V = {1, 2, 3, 4, 5} and edges E = {e1,2, e1,3, e2,3, e2,5, e3,4, e3,5, e4,5}, but differing edge-weights. The network on the left is identical to the one shown in Figure 2 and discussed in Tables 1 and 2.
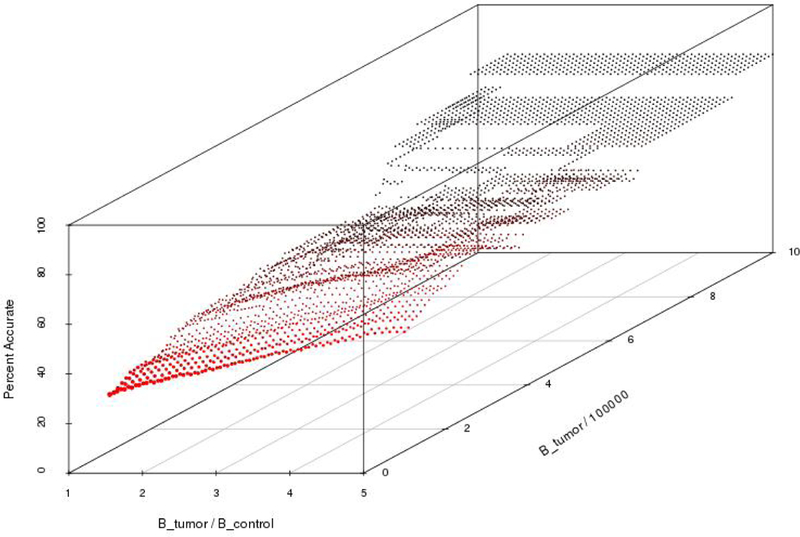
The gene identification accuracy associated with non-parametric bootstrapping. Recall that Btumor and Bcontrol denote the betweenness value of the tumor and control networks, respectively. Thus, the two planar axes represent the threshold values used in Algorithm 1 associated with the ratio of tumor betweenness to control betweenness, and the (scaled) tumor betweenness. For this graph, these are interpreted as the threshold values used to identify essentially different genes. The graph is generated as follows: For each value on the plane, (Btumor/Bcontrol, Btumor × 10−5), Algorithm 1 is applied with these threshold values, using non-parametric bootstrapping to generate the 100 simulated networks in Step 4. This results in a set of essentially different genes and a set of significantly different genes, from which the accuracy, as defined by Equation (5), is calculated. This accuracy value determines the height of the graph at the given point on the plane.
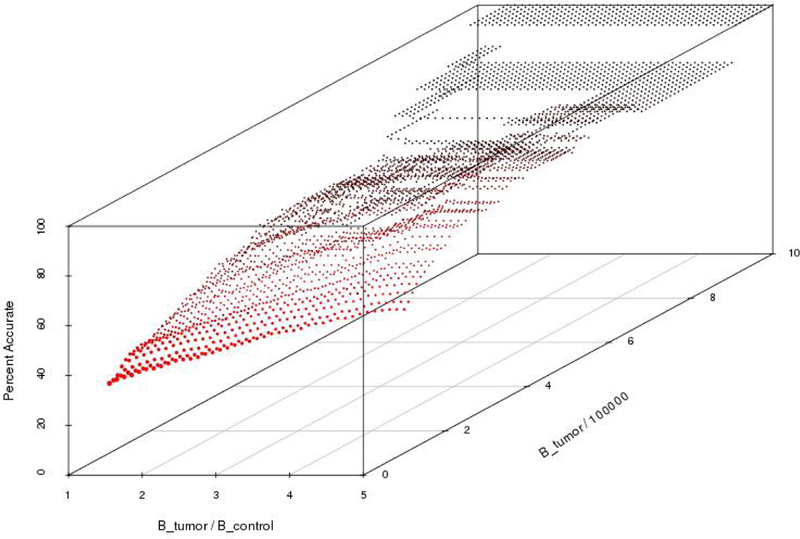
This graph represents the gene identification accuracy for each (Btumor/Bcontrol, Btumor × 10−5) set of threshold values, similar to Figure 4. In this figure, the 100 simulated networks in Step 4 of Algorithm 1 are generated by adding noise to the edge-weights. To each initial edge-weight, r, we add noise with a truncated Normal distribution centered at r with standard deviation given by Equation (4).
References
-
- Han J-DJ, Bertin N, Hao T, Goldberg DS, Berriz GF, Zhang LV, Dupuy D, Walhout AJ, Cusick ME, Roth FP, et al., “Evidence for dynamically organized modularity in the yeast protein–protein interaction network,” Nature, vol. 430, no. 6995, p. 88, 2004. - PubMed
-
- Jeong H, Mason SP, Barabási A-L, and Oltvai ZN, “Lethality and centrality in protein networks,” Nature, vol. 411, no. 6833, p. 41, 2001. - PubMed
-
- Freeman LC, “A set of measures of centrality based on betweenness,” Sociometry, pp. 35–41, 1977.
Publication types
MeSH terms
Grants and funding
LinkOut - more resources
Full Text Sources
