Review
. 2019 Jan 23;119(2):957-1057.
doi: 10.1021/acs.chemrev.8b00363. Epub 2018 Oct 16.

Chemistry of MRI Contrast Agents: Current Challenges and New Frontiers

Affiliations
Review

Chemistry of MRI Contrast Agents: Current Challenges and New Frontiers

Jessica Wahsner et al. Chem Rev. .

Abstract

Tens of millions of contrast-enhanced magnetic resonance imaging (MRI) exams are performed annually around the world. The contrast agents, which improve diagnostic accuracy, are almost exclusively small, hydrophilic gadolinium(III) based chelates. In recent years concerns have arisen surrounding the long-term safety of these compounds, and this has spurred research into alternatives. There has also been a push to develop new molecularly targeted contrast agents or agents that can sense pathological changes in the local environment. This comprehensive review describes the state of the art of clinically approved contrast agents, their mechanism of action, and factors influencing their safety. From there we describe different mechanisms of generating MR image contrast such as relaxation, chemical exchange saturation transfer, and direct detection and the types of molecules that are effective for these purposes. Next we describe efforts to make safer contrast agents either by increasing relaxivity, increasing resistance to metal ion release, or by moving to gadolinium(III)-free alternatives. Finally we survey approaches to make contrast agents more specific for pathology either by direct biochemical targeting or by the design of responsive or activatable contrast agents.


Figures

Figure 1:
Figure 1:
Route of administration of MRI contrast agents.
Figure 2:
Figure 2:
Main distribution sites and excretion pathways for intravenously administered soluble metal complexes.
Figure 3:
Figure 3:
Commercially approved T1 contrast agents (NMG = meglumine).
Figure 4:
Figure 4:
Chemical structures of the Gd(III)-based blood pool contrast agents (charges and counter ions are omitted for simplicity).
Figure 5:
Figure 5:
Longitudinal (left) and transverse (right) relaxivities (mM−1s−1) of some commercial gadolinium(III)-based contrast agents at different magnetic fields (green = 0.47 T, red = 1.5 T, blue = 3 T) in human plasma at 37 ºC.
Figure 6:
Figure 6:
Paramagnetic contribution of 1 mM of T1 contrast agent Gd-DOTA on 1/T1 and 1/T2 in cortical grey matter at 1.5 T.
Figure 7:
Figure 7:
Axial T1-weighted MR images obtained at 3 T before (left) and 20 minutes after intravenous gadoteridol administration (right) of patient with glioblastoma. Reproduced with permission of Ref. (URL: https://pubs.rsna.org/doi/abs/10.1148/radiol.12111472). Copyright 2013 Radiological Society of North America (RSNA®).
Figure 8:
Figure 8:
Paramagnetic contribution of 1 mM of T2 contrast agent ferucarbotran on 1/T1 and 1/T2 in cortical grey matter at 1.5 T.
Figure 9:
Figure 9:
T2-weighted images obtained before and 24 hours after intravenous ferumoxytol administration show deep white matter lesions, demonstrated through several areas of confluent, focal, strong signal loss due to ferumoxytol uptake (arrows). Reproduced with permission of Ref. (URL: http://n.neurology.org/content/neurology/81/3/256). Copyright 2013 Wolters Kluwer Health, Inc.
Figure 10:
Figure 10:
CEST agents that are approved for use in clinical trials: glucose and iopamidol.
Figure 11:
Figure 11:
Chemical structures of some PFCs: left, hexafluorobenzene (HFB); center, perfluoro-15-crown-5-ether (PFCE); right, tetra(perfluorotertbutyl)pentaerythritol (PERFECTA).
Figure 12:
Figure 12:
Examples of hydrophilic fluorinated molecules studied by Annapragada and coworkers.
Figure 13:
Figure 13:
Examples of fluorinated compounds studied by Parker and coworkers in order to boost the 19F MRI – SNR.
Figure 14:
Figure 14:
Change in the longitudinal relaxation time (a) and in the relaxivity (b) as a function of the concentration of contrast agent in three different tissues: heart (T10 = 1200 ms), liver (T10 = 590 ms) and subcutaneous fat (T10 = 340 ms); supposing in every case r1 = 4 mM−1s−1.
Figure 15:
Figure 15:
Effect of field strength on relaxivity and contrast in the case of Gd-DOTA (left) and MS-325 (right) in white matter (WM) and grey matter (GM).
Figure 16:
Figure 16:
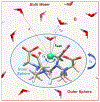
Pictorial description of the parameters that influence the relaxivity of a MRI contrast agent.
Figure 17:
Figure 17:
Gadolinium(III) complexes studied by 1H ENDOR where the Gd-H(water) distance was determined.
Figure 18:
Figure 18:
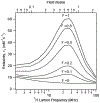
Experimental 1H NMRD profiles showing relaxivity (per Gd(III)) versus field strength for Gd-DTPA derivatives with short (A, MS-325), intermediate (B, EP-1084), and long (C, MS-325 in HSA solution) rotational correlation times.
Figure 19:
Figure 19:
Effect of water residency time (τm, ns) for an inner-sphere water on r1 (—) and r2 (---) under optimal rotational conditions (τR, ns) at 0.47 T (A, 20 ns), 3 T (B, 0.5 ns), and 9.4 T (C, 0.5 ns). The optimal τm range increases as field increases. Reproduced with permission from Ref. (URL: http://dx.doi.org/10.1002/cmmi.267). Copyright 2009 John Wiley and Sons.
Figure 20:
Figure 20:
TSAP and SAP isomers of DOTA-type ligands of macrocyclic lanthanide chelates.
Figure 21:
Figure 21:
Chirality sources within DOTA-like macrocyclic structures.
Figure 22:
Figure 22:
Ligands forming HSA-binding Gd(III) complexes without any water molecules in the inner-sphere (q = 0).
Figure 23:
Figure 23:
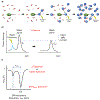
(a) Illustration of a CEST process: exchangable amine protons of a CEST agent are selectively saturated using radio frequency (RF) irradiation, leading to a reduction of the amine 1H signal intensity. Because of chemical exchange, the saturated protons (shown as blue spheres) are transferred to the bulk water pool. Continous chemical exchange during the saturation experiment leads to the amplification of the water signal reduction. (b) Continuous application of RF pulses leads to the saturation of more bulk water protons, thereby decreasing the 1H-NMR signal. (c) Z-spectrum (top): normalized water intensity (I/I0) vs off-resonance frequency (ΔRF), taking as 0.0 ppm the water resonance and the magnetization transfer ratio asymmetry (MTRasym) (ΔCS = separation in chemical shift between the two proton pools) spectrum (bottom): which shows the Z-spectrum asymmetry vs off-resonance frequency (ΔRF).
Figure 24:
Figure 24:
Exogenous agents (blue) and endogenous biomolecules (red) that can be detected when applying a saturation pulse at the magnetic resonance frequencies listed in the chart. (A) Aryl acid agents, (B) aryl amide agents, (C) amides, (D) glutamate, (E) amines, (F) glucose, and (G) lactic acid. Paramagnetic compounds have much wider chemical shift ranges.
Figure 25:
Figure 25:
Simplified scheme of a liposome (A) and a lipoCEST agent (B). 1H NMR spectra focused on the region of the water signal, in a regular liposome (C) and in a lipoCEST agent (D).
Figure 26:
Figure 26:
Ligand systems: PCTA, AAZTA, CyPic3A, aDO3A and tacn(1-Me-3,2-hopo)3 that form thermodynamically stable Gd(III)-complexes with extended hydration sphere.
Figure 27:
Figure 27:
Left: Structure of P03277; Right: Axial T1-weigthed images of the hepatic metastasis A) before and B) after intravenous injection of 0.1 mmol kg−1 gadobutrol,; C) before and D) after intravenous injection of 0.1 mmol kg−1 P03277. Arrow shows tumor. Reproduced with permission from Ref. (URL: https://journals.lww.com/10.1097/RLI.0000000000000192). Copyright 2015 Wolters Kluwer Health, Inc.
Figure 28:
Figure 28:
Left: Plot of r1 (0.5 T and 25 °C) for monohydrated DOTA-based Gd(III) complexes vs. molecular weight (R = 0.984). Right: Plot of τR evaluated from the NMRD profiles, vs. molecular weight (R = 0.991). Reproduced with permission from Ref. (URL http://dx.doi.org/10.1039/9781788010146-00121). Copyright 2018 Royal Society of Chemistry.
Figure 29:
Figure 29:
Chemical structure of the chelators mentioned in Figure 28.
Figure 30:
Figure 30:
Different strategies to increase relaxivity by modulating rotational motion: A) linear polymer of Gd(III)-complexes that rotates anisotropic (low relaxivity); B) Gd(III) chelates assembled to a dendrimer that rotates isotropically, but internal motion is still possible (higher relaxivity); C) Gd(III)-complex at the barycenter of the molecule, so that it can only rotate at the rate of the entire molecule (highest relaxivity).
Figure 31:
Figure 31:
Restricting the water ligand mobility (specifically rotation about the Gd-O bond), in Gd(III) complexes through interaction with an intramolecular H-bond acceptor. Reproduced with permission from Ref. (URL: http://dx.doi.org/10.1002/anie.201702274). Copyright 2017 John Wiley and Sons.
Figure 32:
Figure 32:
Simulation illustrating the effect of internal motion on the field dependent T1 relaxivity (hypothetical Gd(III)-compound with a global correlation time of 10 ns and a local correlation time with 0.1 ns. F gives the degree of internal motion.
Figure 33:
Figure 33:
Strategies for increasing relaxivity: A) Gd(III)-complex with targeting moiety that tumbles fast (low relaxivity); B) Binding of the Gd(III)-complex to the targeting protein slows tumbling and the relaxivity increases; C) Gd(III)-based multimer bound to the target protein, relaxivity might be limited through internal motion; D) Gd(III)-based multimer bound to the target protein via two points of attachment, limited internal motion increases relaxivity; E) Structure of the Gd-DTPA-based multimer. Reproduced with permission from Ref. (URL: http://dx.doi.org/10.1002/anie.200502245). Copyright 2005 John Wiley and Sons.
Figure 34:
Figure 34:
T1 relaxivities of Gd3L3 (sphere), MS-325 with excess HSA (triangle) and Gd-HPDO3A (diamond) as a function of magnetic field strength at 37 °C. A) T1 relaxivity plotted per molecule, at 60 MHz and higher frequency: molecules with intermediate correlation time (Gd3L3) are much more potent relaxation agents than slow (MS-325 with excess HSA) or fast Gd-HPDO3A tumbling compounds; B) T1 relaxivity plotted per Gd(III)-ion shows the same trend. Reproduced from Ref. (URL: http://dx.doi.org/10.1021/ja309187m). Copyright 2012 American Chemical Society.
Figure 35:
Figure 35:
Chemical structure of the Gd3L3.
Figure 36:
Figure 36:
Left: Effect of rotational correlation time on T1 relaxivity as a function of field for a Gd(III) complex with a water residency time 100 ns. τR = 0.1 ns (…), 1.0 ns (---), 10 ns (—). Reproduced with permission from Ref. (URL: http://dx.doi.org/10.1002/cmmi.267). Copyright 2009 John Wiley and Sons. Right: Effect of HSA binding on T1 relaxation rate for MS-325. Reproduced from Ref. (URL: http://dx.doi.org/10.1021/ja017168k). Copyright 2002 American Chemical Society.
Figure 37:
Figure 37:
Relaxivity of 0.1 mM MS-325 and MS-325-BMA in pH 7.4 phosphate buffered saline or 0.67 mM HSA solution at 37 °C and 0.47 T. MS-325 is 88 % bound to HSA under these conditions and MS-325-BMA is 83 % bound.
Figure 38:
Figure 38:
Relaxivity of slow tumbling HSA-bound Gd-DOTA derivatives plotted vs. measured water residency time at 37 °C at 20 MHz (filled triangles) or 60 MHz (open triangles), respectively. τm limits relaxivity at a given field strength if it is either too short or too long. The range of τm for optimal relaxivity becomes broader at higher field. Reproduced with permission from Ref. (URL: https://journals.lww.com/10.1097/RLI.0b013e3181ee5a9e). Copyright 2010 Wolters Kluwer Health, Inc.
Figure 39:
Figure 39:
Chemical structures of Gd-EPTPA, Gd-DO3A-pyNox, Gd-DO3APABn, and Gd-ebpatcn.
Figure 40:
Figure 40:
NMRD relaxivity profiles of Gd-DOTA-NPs at different concentrations (T = 37 °C) showing the characteristic shape of a compound with slow rotational correlation times. These results indicate that the rotational motion of Gd-DOTA inside the hydrogel is restricted. Dotted line: NMRD relaxivity profile of Gd-DOTA (T = 37 °C). Reproduced with permission from Ref. (URL: https://onlinelibrary.wiley.com/doi/abs/10.1002/anie.201203190). Copyright 2012 John Wiley and Sons.
Figure 41:
Figure 41:
Thermodynamic stability of Gd-TRITA and Gd-TETA.
Figure 42:
Figure 42:
Chemical structure of selected ligand systems.
Figure 43:
Figure 43:
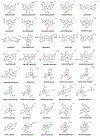
Mn(II) complexes previously considered in the context of MRI contrast.
Figure 44:
Figure 44:
Multiplanar reformatted coronal images from three-dimensional T1-weighted gradient echo (volume-interpolated breathhold examination) sequence acquired at 3.0 T show abdominal aorta and renal arteries, A, prior to injection of contrast agent, B, 9 seconds after injection of 0.1 mmol/kg Mn-PyC3A, and, C, 9 seconds after injection of 0.1 mmol/kg Gd-DTPA. Reproduced with permission from Ref. (URL: https://pubs.rsna.org/doi/abs/10.1148/radiol.2017170977). Copyright 2017 Radiological Society of North America (RSNA®).
Figure 45:
Figure 45:
Mn(III) complexes explored as high-relaxivity MRI contrast agents.
Figure 46:
Figure 46:
(A) The Fe(III) complexes Fe-HBED and Fe-EHPG and (B) have been considered as hepatobiliary specific contrast agents. (B) The Fe(II) complexes Fe-DPTACN and Fe-DTTACN have been considered as contrast agents.
Figure 47:
Figure 47:
Eu(II) complexes considered as potential MRI contrast agents.
Figure 48:
Figure 48:
The nitroxide radicals 3-CP and chex have been evaluated as MRI contrast agents.
Figure 49:
Figure 49:
Iodinated X-ray contrast agents have been evaluated as DiaCEST contrast agents.
Figure 50:
Figure 50:
The exchangeable amide protons of Dy-DOTAM provide a greater CEST effect than the protons of the exchangeable water co-ligand because the amide protons are further from the Dy(III) ion and thus experience a weaker paramagnetic relaxation effect.
Figure 51:
Figure 51:
A) Fibrin-targeting contrast agent EP-2104R is the only biochemically targeted agent to be used to detect a pathologic biomarker in humans. B) Short axis view of the heart before EP-2104R injection. The arrow indicates the location of a left ventricular thrombus that is difficult to discern in the baseline scan. C) The thrombus is highly conspicuous for several hours after EP-2104R injection. Reproduced with permission from Ref. (URL: https://link.springer.com/article/10.1007%2Fs00330-008-0965-2). Copyright 2008 Springer Nature.
Figure 52:
Figure 52:
The Mn-based fibrin-seeking contrast agent Mn-FBP is comprised of 4 Mn-PyC3A chelators conjugated to a fibrin-binding peptide.
Figure 53:
Figure 53:
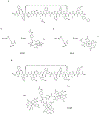
A) Collagen-targeting MRI contrast agents are derived from a collagen-binding peptide identified via high-throughput screen to possess high specificity and affinity for typeI collagen. B,C) The collagen-targeted agents EP-3533 and CM-101 are comprised of the collagen-binding peptide and 3 Gd-DTPA or Gd-DOTA chelators connected to the peptide N-terminus and lysine ε-side chains via thiourea or amide linkages, respectively. C) EP-3600 is comprised of the collagen-binding peptide and a trimeric Gd-DOTA containing scaffold via the peptide N-terminus.
Figure 54:
Figure 54:
Change in contrast-to-noise ratio (CNR) following CM-101 injection in bile duct ligated (BDL, liver fibrosis) and sham operated (healthy non-fibrotic liver) rats. A) Representative dynamic time courses of the change in CNR between liver and muscle tissue for BDL (red dots) and sham (blue dots) treated rats following injection of CM-101. The maximal difference in ΔCNR (green line) between sham operated and BDL rats was observed at approximately 15-20 minutes following CM-101 injection. B) A statistically significant difference in the area under the ΔCNR curve (AUC) between sham operated and BDL rats was observed. C) A statistically significant difference in ΔCNR between sham operated and BDL rats was also observed at 15 minutes post CM-101 injection. D) Representative T1-weighted images acquired pre CM-101 (baseline) and 15 minutes post CM-101 injection. Notice that the fibrotic liver is markedly enhanced with CM-101 but healthy liver is not. Reproduced with permission from Ref. (URL: https://pubs.rsna.org/doi/10.1148/radiol.2017170595). Copyright 2017 Radiological Society of North America (RSNA®).
Figure 55:
Figure 55:
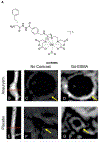
A) Allysine-targeted agents Gd-Hyd and Gd-OA, and their corresponding non-targeted control agents Gd-DiMe and Gd-OX. B-D) Imaging and ex vivo tissue analyses for Gd-OA (allysine-targeting) an in naive (no fibrogenesis) and bleomycin (Bleo) injured (active fibrogenesis) mice. B) Quantification of the change in lung-to-muscle signal intensity ratio following injection of Gd-OA to naïve and Bleo injured mice. C) Quantification of allysine in naïve and Bleo injured mice. D) Coronal MR images of naïve and bleomycin injured mice where the false color overlay is the difference image of the post Gd-OA image and the baseline image. Reproduced with permission from Ref. (URL: https://onlinelibrary.wiley.com/doi/abs/10.1002/anie.201704773). Copyright 2017 John Wiley and Sons.
Figure 56:
Figure 56:
The CLT1 and CREKA peptides identified via high-throughput screen to bind to the fibrin-fibronectic complex with high affinity. A) A fibronectin-targeting agents comprised of Gd-DTPA conjugated to CLT1 via the peptide N-terminus and high payload fibronectin-targeting agents comprising multimeric Gd(III)-complexes (R1 and R2) conjugated to the to the CREKA peptide. B) One high-payload fibronectin-targeting agent was assembled by conjugating a tetrameric Gd-DOTA scaffold to the CREKA N-terminus, C) another was assembled via conjugation of a trimeric Gd-DOTA scaffold to the cysteine side chain S.
Figure 57:
Figure 57:
(A) Elastin-targeting MRI contrast agent Gd-ESMA. (B-G) show MR imaging of the suprarenal abdominal aorta in placebo treated mice (B-D) and mice bearing a pharmacologically-induced abdominal aortic aneurysm (E-G). Time of flight MR angiograms are shown in (B) and (E), the red lines mark the axial cross sections of the vessels depicted in images (B-D) and (F-G). Images (C-D) and (F-G) were acquired using the same T1-weighted protocol. (C) and (F) were acquired without contrast enhancement, whereas (D) and (G) were contrast-enhanced using Gd-ESMA. The aneurysm bearing vessel is strongly enhanced compared to the vessel in the negative control animal because an increase in elastin content accompanies the compensatory remodeling of vessel wall at the site of the dilation. Reproduced with permission from Ref. (URL: https://www.ahajournals.org/doi/full/10.1161/CIRCIMAGING.113.001131). Copyright 2014 Wolters Kluwer Health, Inc.
Figure 58:
Figure 58:
Myelin targeting MRI contrast agent, Case Myelin Compound.
Figure 59:
Figure 59:
Comparison of (A) Gd-DOTA enhanced and (B) glucose enhanced imaging in a 45 year old woman with glioblastoma, the Gd-DOTA and glucose enhanced images are fused in (C) Glucose accumulates in proliferating cells and provides strong contrast enhancement in T1ρ-weighted images. The glucose enhanced images provide strong signal intensity in the dorsomedial regions of the tumor that overlap with T1-enhancement, but also strong enhancement beyond the blood-brain barrier disruption. Reproduced with permission from Ref. (URL: https://pubs.rsna.org/doi/10.1148/radiol.2017162351). Copyright 2017 Radiological Society of North America (RSNA®).
Figure 60:
Figure 60:
High-affinity folate receptor-targeting MRI contrast agent comprised of folate conjugated to Gd-DOTA via a bis(aminoethyl)glyocol linker.
Figure 61:
Figure 61:
Gd-DTPA-B(SLex)A is an E-selectin-targeting agent. This agent has been used to image endothelial cell activation in a mouse model of fulminant hepatitis.
Figure 62:
Figure 62:
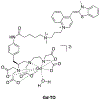
Gd-TO binds to extracellular DNA via DNA intercalation of the appended thiazole orange dye. This agent has been used to image necrosis in a mouse model of myocardial infarction and to monitor the dynamics of extracellular DNA clearance after an acute necrotic event.
Figure 63:
Figure 63:
Detecting enzyme activity with a Gd(III)-based MR contrast agent through changes in T1 relaxation caused by modulation of inner-sphere hydration state. Chemical structures of the first (A) and second (B) generation β-galactosidase sensors. C) Enzymatic cleavage of β-galactose frees one coordination side that becomes accessible by water molecules. D) Two living Xenopus laevis embryos were injected with the second generation of the β-galactosidase sensor. The embryo shown on the right was also injected with β-galactosidase mRNA. The pseudocolor rendering of MR images shows that the signal strength is 45 – 65 % greater in the embryo treated with ß-galactosidase mRNA, demonstrating the detection of β-galactosidase activity. Labeled anatomy: (e) eye, (c) cement gland, (s) somite, (b) brachial arches. Reproduced with permission from Ref. (URL: http://dx.doi.org/10.1038/73780). Copyright 2000 Springer Nature.
Figure 64:
Figure 64:
Selected pH-responsive T1 relaxivity agents.,, , –
Figure 65:
Figure 65:
Selected pH-responsive T1 relaxivity agents.
Figure 66:
Figure 66:
Selected pH-responsive DiaCEST agents., , –
Figure 67:
Figure 67:
pH dependency of proton exchange and its relationship to CEST. Left: 1H-NMR spectra of poly-L-lysine at different pH. Right: CEST spectra of poly-L-lysine at different pH. The proton exchange accelerates with increasing pH, which broadens the corresponding 1H-NMR signal but amplifies the CEST signal. Reproduced with permission from Ref. (URL: http://dx.doi.org/10.1002/mrm.20818). Copyright 2006 John Wiley and Sons.
Figure 68:
Figure 68:
Selected pH-responsive ParaCEST agents (protons employed for CEST imaging are shown in red).
Figure 69:
Figure 69:
T2W images (7 T) acquired pre (A) and 2 min post (D) i.v. injection of Yb-HPDO3A (dose: 1.2 mmol kg−1); STmaps calculated at 66 ppm pre (B) and 2 min post (E) i.v. injection of Yb-HPDO3A; STmaps calculated at 92 ppm pre (C) and 2 min post (F) i.v. injection of Yb-HPDO3A; G) pH map of a region of a tumor isolated in slice one calculated from the corresponding ST maps. Reproduced with permission from Ref. (URL: http://dx.doi.org/10.1002/mrm.24664). Copyright 2014 John Wiley and Sons.
Figure 70:
Figure 70:
First frequency-responsive transition-metal based ParaCEST agent that reports on pH.
Figure 71:
Figure 71:
pH-responsive ParaSHIFT agent.
Figure 72:
Figure 72:
Selected enzyme-responsive T1 MRI contrast agents (enzyme cleavable entities are shown in blue).–,
Figure 73:
Figure 73:
A) Chemical structure of D-DOTA(Gd); B) Interaction of Gd-DTPA-diTyr with activated tyrosinase can result in: a) oligomers and b) contrast agent-albumin conjugates. Both products yield an increase in relaxivity. Reproduced with permission from Ref. (URL: http://dx.doi.org/10.1002/cbic.200700157). Copyright 2007 John Wiley and Sons. C) Tyrosinase-responsive Mn(II) ligands.
Figure 74:
Figure 74:
Design and mechanism of action of the caspase-3-sensitive nanoaggregation MRI probe (C-SNAM). (left) Chemical structure of C-SNAM (1). Caspase-3 catalyzed DEVD peptide cleavage and GSH mediated disulfide reduction triggers a biocompatible intramolecular cyclization reaction that yields the rigid and hydrophobic macrocycle (2). Subsequent self-assembly to Gd(III) containing nanoparticles increases r1 by 90 %. (right) Mechanism of action in vivo: (top) Intra-articular injection of C-SNAM into rat knee joints with implants of apoptotic and viable stem cells. (bottom) Caspase-3 mediated activation leads to an enhanced MRI signal through increased T1 relaxivity and retention in apoptotic stem cell transplants. Reproduced from Ref. (URL: https://doi.org/10.1021/nn504494c). Copyright 2015 American Chemical Society.
Figure 75:
Figure 75:
Chemical structure of Gd-DOTA-DEVD-Tfb.
Figure 76:
Figure 76:
Selected enzyme-responsive ParaCEST MRI contrast agents (enzyme cleavable entities are shown in blue)., , –,
Figure 77:
Figure 77:
Selected enzyme-responsive DiaCEST MRI contrast agents (enzyme cleavable entities are shown in blue)., –
Figure 78:
Figure 78:
Selected redox potential-responsive T1 contrast agents., , –, –, ,
Figure 79:
Figure 79:
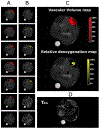
Vascular volume and relative deoxygenation maps of a representative tumor. (A) Vascular volume maps of 7 slices covering the tumor; (B) relative deoxygenation maps of 7 slices covering the tumor; (C) magnification of vascular volume (top) and relative deoxygenation (bottom) maps of the central slice of tumor; (D) T2w image of the central slice of tumor. Reproduced from Ref. (URL: https://doi.org/10.1021/acsnano.5b02604). Copyright 2015 American Chemical Society.
Figure 80:
Figure 80:
Selected redox potential responsive ParaCEST agents., , –
Figure 81:
Figure 81:
A) Schematic representation of the dual T1-CEST liposomal agent. The CEST contrast is activated after cleavage of the Gd(III)-complexes by a biological trigger, e.g. reducing environment. B) MR images of a phantom at 7 T and 37 °C of 1) LipoCEST agent 2) LipoCEST agent modified with free thiol groups on the surface 3) LipoCEST agent modified witch Gd-DO3A derivative via disulfide linkage (LipoCEST-SS-DO3A) 4) Treatment of LipoCEST-SS-DO3A with the reducing agent TCEP. Left: T1 weighted images; right: CEST map upon radiation at 3.5 ppm overlaid on a T2-weighted image of the phantom. Reproduced with permission from Ref. (URL: http://dx.doi.org/10.1039/C1CC10172B). Copyright 2011 Royal Society of Chemistry.
Figure 82:
Figure 82:
Selected Zn(II) binding MRI contrast agents.
Figure 83:
Figure 83:
A) Structure of Gd-CP027; B) Gd-CP027 binds to Zn(II) and forms a complex with HSA; C) Glucose sensitive contrast enhanced (GSCE) T1 weighted MR images at 9.4 T of the prostate of mice during various stages of tumor development: (Bottom) image of a normal healthy prostate (Middle) image of malignant prostate with WD tumor shows clear hypointensity due to the presumable lack of intracellular Zn(II) (top) image of malignant prostate with PD shows no GSCE D) Average GSCE measured over the entire prostate of mice (WD tumor = well differentiated tumors, PD tumor = poorly differentiated tumor). Reproduced from Ref. (URL: http://www.pnas.org/content/113/37/E5464). Copyright 2016 National Academy of Science.
Figure 84:
Figure 84:
Selected Zn(II) binding MRI contrast agents.
Figure 85:
Figure 85:
A) Ca(II)-responsive MRI contrast agent B) Ca(II)-responsive MRI contrast agent that can discriminate between extra- and intracellular Ca(II) ions.
Figure 86:
Figure 86:
Selected Ca(II) binding MRI contrast agents.–, ,
Figure 87:
Figure 87:
Schematic mechanism that causes the change in T1 relaxivity in the presence of Ca(II)-ions of a liposomal Ca(II)-responsive Gd(III)-based contrast agent. Reproduced from Ref. (URL: https://doi.org/10.1021/acs.biomac.5b01668). Copyright 2016 American Chemical Society.
Figure 88:
Figure 88:
A) Schematic illustration of a copper binding Gd(III)-based probe that changes its hydration state in the presence of copper ions. B) – E) Selected Cu(I)/Cu(II) binding MRI contrast agents.
Figure 89:
Figure 89:
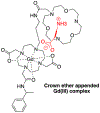
A crown ether appended Gd(III)-complex capable of sensing zwitterionic amino acid neurotransmitters.
Figure 90:
Figure 90:
Schematic concept of thermosensitive microgels based on a manganese porphyrin core incorporated in a cross-linked poly(N-isopropylacrylamide) material. LCST: lower critical solution temperature 29 – 33 °C. Reproduced from Ref. (URL: https://doi.org/10.1021/acsmacrolett.5b00058). Copyright 2015 American Chemical Society.
Figure 91:
Figure 91:
Proposed mechanism of light-induced reversible aggregation of iron oxide nanoparticles coupled to a spyropyran derivative. Reproduced from Ref. (URL: https://doi.org/10.1021/ja100254m). Copyright 2010 American Chemical Society.
Figure 92:
Figure 92:
A-C) T1-weighted images showing short axis views of the infarct bearing hearts of wild type, heterozygous, and homozygous myeloperoxidase knockout mice, respectively. The myocardial infarction is donoted by the solid yellow arrows and the remote myocardium is denoted by the open yellow block arrows. D) Infract zone vs. remote myocardium CNR is tightly correlated to myeloperoxidase activity within the infarction. Reproduced with permission from Ref. (URL: https://www.ahajournals.org/doi/full/10.1161/CIRCULATIONAHA.107.756510). Copyright 2008 Wolters Kluwer Health, Inc.
Figure 93:
Figure 93:
Coronal view of the liver of a Type I diabetes patient receiving implantation of ferucarbotran labelled pancreatic islets via portal vein injection. A-E) Images were acquired prior to, 1 day, 1 week, 4 weeks, and 28 weeks after transplantation, respectively. The images show that roughly 60% of the engrafted islet do not survive past 1 week after engraftment, but most of the surviving islets persist out past 24 weeks. Reproduced with permission from Ref. (URL: https://doi.org/10.1097%2FTP.0b013e3181ffba5e). Copyright 2010 Wolters Kluwer Health, Inc.
Figure 94:
Figure 94:
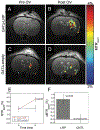
CEST MTRassym maps overlaid with T2-weighted images of glioma bearing rat brain prior to and 8h after injection G47Δ carrying the LRP reporter and LRP empty control virus. (A,B) Images recorded prior to and 8h after direct intratumoral injection of G47Δ carrying the LRP reporter. (C,D) Images recorded prior to and 8h after direct intratumoral injection of LRP empty G47Δ. (E) Comparison of MTRassym prior to and 8h after treatment with virus carrying the LRP reporter gene and LRP empty control. (F) Comparison of ΔMTRassym observed 8h after treatment with virus carrying the LRP reporter gene and LRP empty control. Reproduced with permission from Ref. (URL: https://pubs.rsna.org/doi/10.1148/radiol.14140251). Copyright 2015 Radiological Society of North America (RSNA®).

References

    1. Runge VM Critical Questions Regarding Gadolinium Deposition in the Brain and Body after Injections of the Gadolinium-Based Contrast Agents, Safety, and Clinical Recommendations in Consideration of the EMA’s Pharmacovigilance and Risk Assessment Committee Recommendation for Suspension of the Marketing Authorizations for 4 Linear Agents. Invest. Radiol 2017, 52, 317–323. - PubMed
    1. Caravan P; Ellison JJ; McMurry TJ; Lauffer RB Gadolinium(III) Chelates as MRI Contrast Agents: Structure, Dynamics, and Applications. Chem. Rev 1999, 99, 2293–2352. - PubMed
    1. Edelman RR; Hesselink JR; Zlatkin MB; Crues JV III Clinical Magnetic Resonance Imaging - Volume 3 Elsevier Health: St. Louis, 2006.
    1. Prince MR; Zhang HL; Zou ZT; Staron RB; Brill PW Incidence of Immediate Gadolinium Contrast Media Reactions. Am. J. Roentgenol 2011, 196, W138–W143. - PubMed
    1. Grobner T Gadolinium – A Specific Trigger for the Development of Nephrogenic Fibrosing Dermopathy and Nephrogenic Systemic Fibrosis? Nephrol. Dial. Transplant 2006, 21, 1104–1108. - PubMed

Publication types