. 2018 Dec;99(6):1625-1632.
doi: 10.4269/ajtmh.18-0099.

The Effect of School Closure on Hand, Foot, and Mouth Disease Transmission in Singapore: A Modeling Approach

Affiliations

The Effect of School Closure on Hand, Foot, and Mouth Disease Transmission in Singapore: A Modeling Approach

Yirong Chen et al. Am J Trop Med Hyg. 2018 Dec.

Abstract

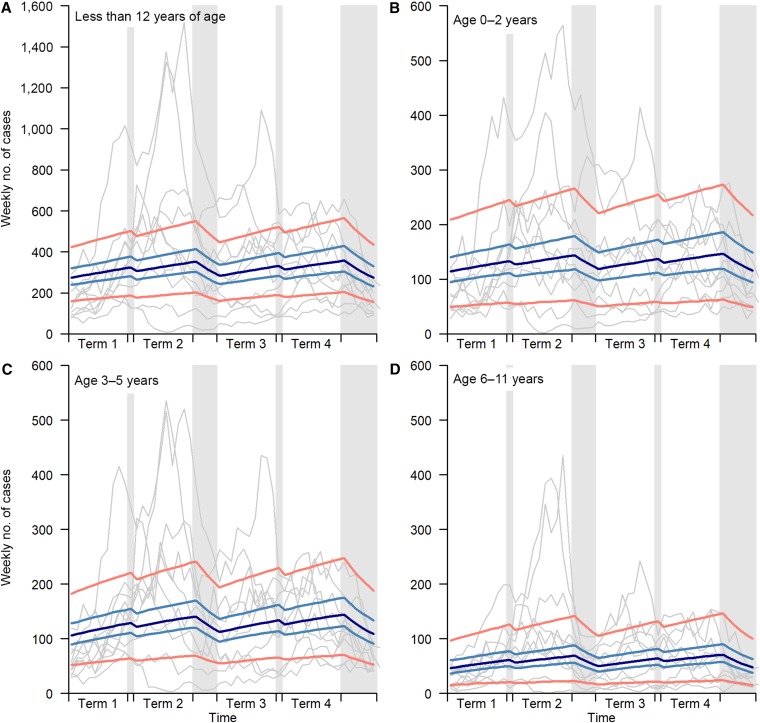
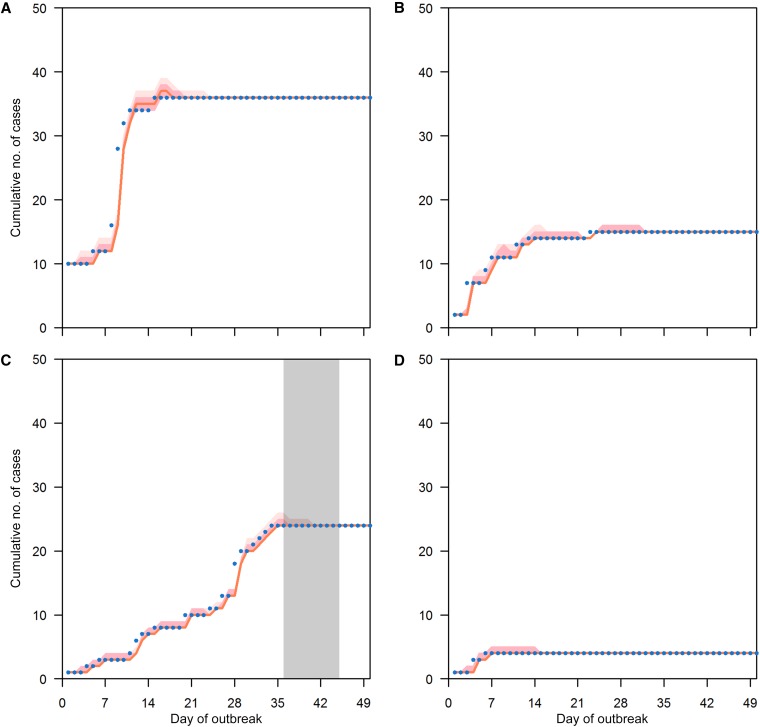
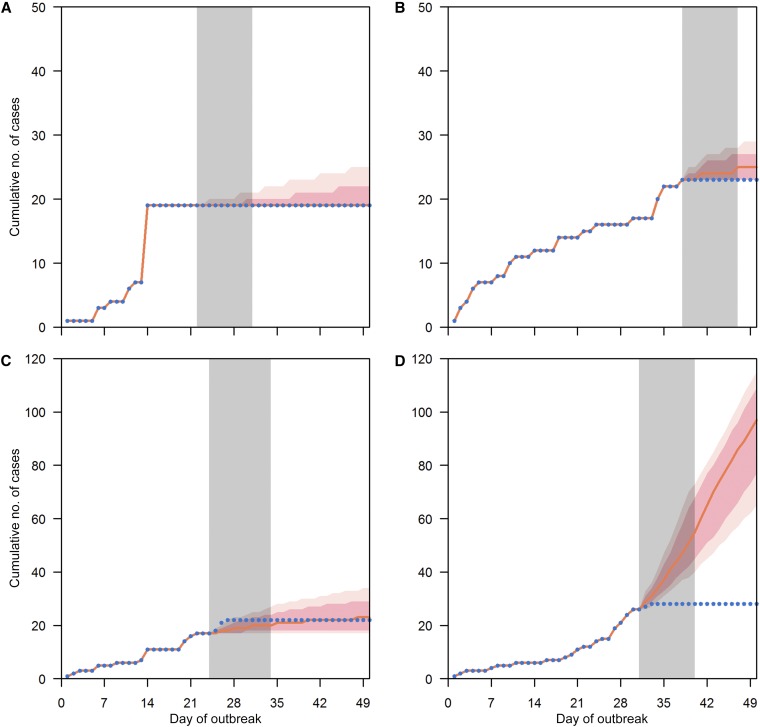
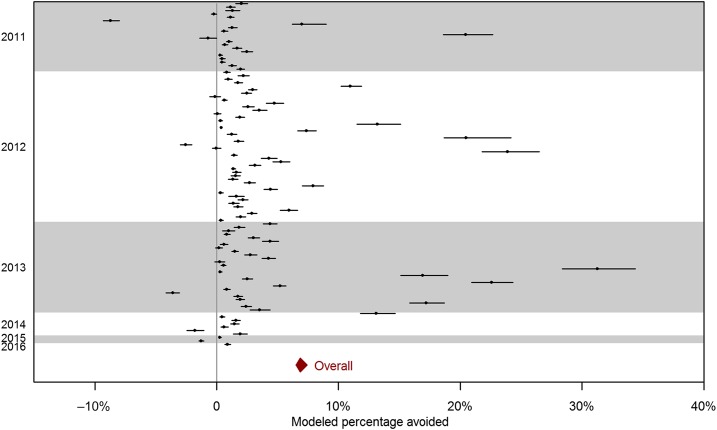
Singapore implements a school closure policy for institutional hand, foot, and mouth disease (HFMD) outbreaks, but there is a lack of empirical evidence on the effect of closure on HFMD transmission. We conducted a retrospective analysis of 197,207 cases of HFMD over the period 2003-2012 at the national level and of 57,502 cases in 10,080 institutional outbreaks over the period 2011-2016 in Singapore. The effects of school closure due to 1) institutional outbreaks, 2) public holidays, and 3) school vacations were assessed using a Bayesian time series modeling approach. School closure was associated with a reduction in HFMD transmission rate. During public holidays, average numbers of secondary cases having onset the week after dropped by 53% (95% credible interval 44-62%), and during school vacations, the number of secondary cases dropped by 7% (95% credible interval 3-10%). Schools being temporarily closed in response to an institutional outbreak reduced the average number of new cases by 1,204 (95% credible interval 1,140-1,297). Despite the positive effect in reducing transmission, the effect of school closure is relatively small and may not justify the routine use of this measure.


Figures

Figure 1.
Figure 1.
Regular school holiday effect. Effect of school vacations on hand, foot, and mouth disease transmission for school-age children is shown in the figure. Panel A shows the overall effect for all children less than 12 years of age. Panels BD show the effect for infants (aged 0–2 years), preschool children (aged 3–5 years), and primary schoolchildren (aged 6–11 years), respectively. Gray bars indicate typical school vacations in a year. Gray lines are observed incident cases for years from 2003 to 2012. Dark blue lines are simulated average weekly incidents in a typical year and light blue lines and orange lines are 95% confidence interval and 95% prediction interval, respectively. This figure appears in color at www.ajtmh.org.
Figure 2.
Figure 2.
School closure during outbreaks effect. Panels AD show one-day-ahead prediction on the cumulative number of cases for four randomly selected outbreaks (one with closure) based on the model. The gray bar means the school is closed during that period. Blue dots are observed cumulative number of cases. The orange line shows model fitting and light and dark pink shades show 95% and 70% credible intervals, respectively. This figure appears in color at www.ajtmh.org.
Figure 3.
Figure 3.
School closure during outbreaks effect. For outbreaks with school closure, panels AD present the modeled cumulative number of cases if there were no school closure. Gray bars show the period when the school closes. Blue dots are observed cumulative number of cases. Orange line shows the cumulative number of cases if the school was not closed during the closure period. Light pink and dark pink shades are 95% and 70% confidence intervals, respectively. This figure appears in color at www.ajtmh.org.
Figure 4.
Figure 4.
Modeled percentage of cases avoided from school closure for all outbreaks with closures. Black dots indicate the percentage of absolute number of cases avoided compared with school size and the lines are 95% confidence intervals. The red diamond indicates the overall number of cases avoided compared with the total enrolment size of schools with closures and its confidence interval. This figure appears in color at www.ajtmh.org.

References

    1. Ang LW, Koh BK, Chan KP, Chua LT, James L, Goh KT, 2009. Epidemiology and control of hand, foot and mouth disease in Singapore, 2001–2007. Ann Acad Med Singapore 38: 106–112. - PubMed
    1. Koh WM, Bogich T, Siegel K, Jin J, Chong EY, Tan CY, Chen MI, Horby P, Cook AR, 2016. The epidemiology of hand, foot and mouth disease in Asia: a systematic review and analysis. Pediatr Infect Dis J 35: e285–e300. - PMC - PubMed
    1. Centers for Disease Control and Prevention (CDC) , 2012. Notes from the field: severe hand, foot, and mouth disease associated with coxsackievirus A6-Alabama, Connecticut, California, and Nevada, November 2011–February 2012. MMWR Morb Mortal Wkly Rep 61: 213–214. - PubMed
    1. Flett K, et al. 2012. Hand, foot, and mouth disease caused by coxsackievirus A6. Emerg Infect Dis 18: 1702–1704. - PMC - PubMed
    1. van der Sanden S, Koopmans M, Uslu G, van der Avoort H; Dutch Working Group for Clinical Virology , 2009. Epidemiology of enterovirus 71 in The Netherlands, 1963 to 2008. J Clin Microbiol 47: 2826–2833. - PMC - PubMed

Publication types

LinkOut - more resources