

SD-chip enabled quantitative detection of HIV RNA using digital nucleic acid sequence-based amplification (dNASBA)
- PMID: 30351338
- PMCID: PMC6219917
- DOI: 10.1039/c8lc00956b
SD-chip enabled quantitative detection of HIV RNA using digital nucleic acid sequence-based amplification (dNASBA)
Abstract
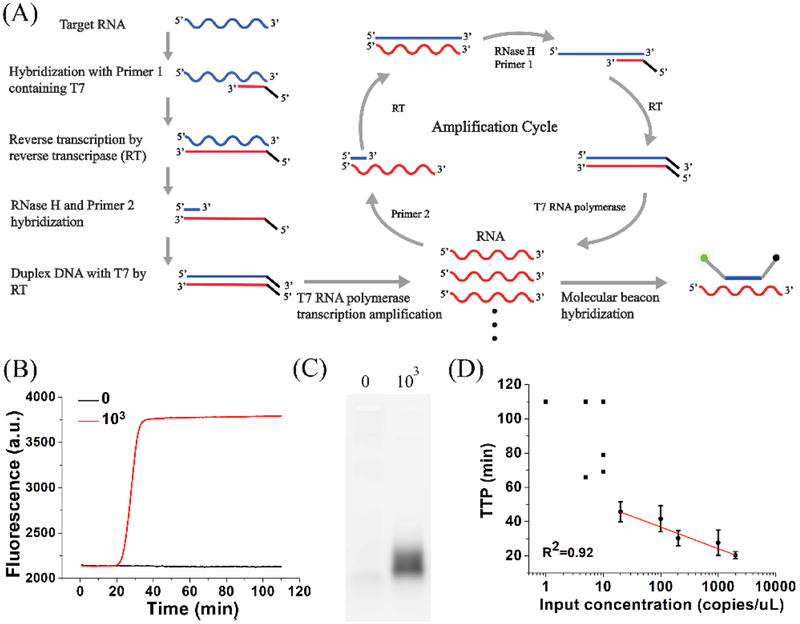
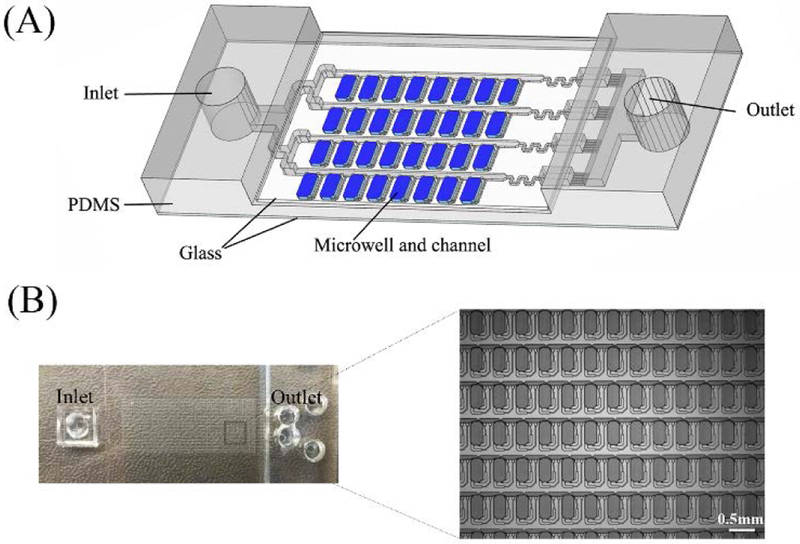
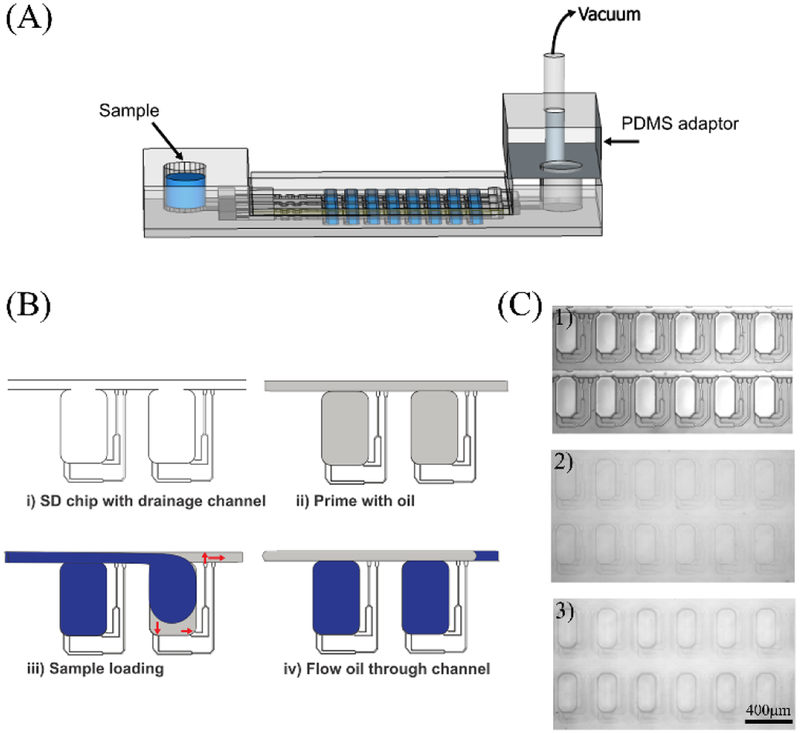
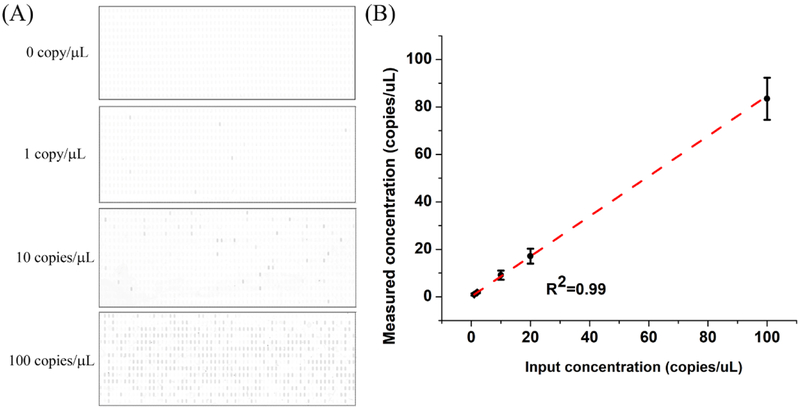
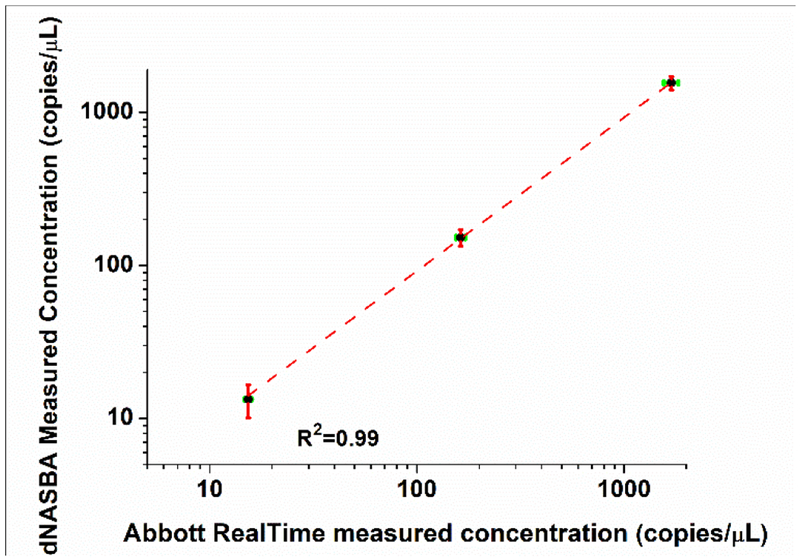
Quantitative detection of RNA is important in molecular biology and clinical diagnostics. Nucleic acid sequence-based amplification (NASBA), a single-step method to amplify single-stranded RNA, is attractive for use in point-of-care (POC) diagnostics because it is an isothermal technique that is as sensitive as RT-PCR with a shorter reaction time. However, NASBA is limited in its ability to provide accurate quantitative information, such as viral load or RNA copy number. Here we test a digital format of NASBA (dNASBA) using a self-digitization (SD) chip platform, and apply it to quantifying HIV-1 RNA. We demonstrate that dNASBA is more sensitive and accurate than the real-time quantitative NASBA, and can be used to quantify HIV-1 RNA in plasma samples. Digital NASBA is thus a promising POC diagnostics tool for use in resource-limited settings.
Figures
Similar articles
-
Characteristics and applications of nucleic acid sequence-based amplification (NASBA).Mol Biotechnol. 2002 Feb;20(2):163-79. doi: 10.1385/MB:20:2:163. Mol Biotechnol. 2002. PMID: 11876473 Review.
-
NASBA technology: isothermal RNA amplification in qualitative and quantitative diagnostics.Immunol Invest. 1997 Jan-Feb;26(1-2):15-28. doi: 10.3109/08820139709048912. Immunol Invest. 1997. PMID: 9037609
-
Evaluation of a real-time nucleic acid sequence-based amplification assay using molecular beacons for detection of human immunodeficiency virus type 1.J Clin Microbiol. 2006 Jun;44(6):2280-2. doi: 10.1128/JCM.02187-05. J Clin Microbiol. 2006. PMID: 16757640 Free PMC article.
-
NASBA Coupled to Paper Microfluidics for RNA Detection.Methods Mol Biol. 2024;2822:51-64. doi: 10.1007/978-1-0716-3918-4_5. Methods Mol Biol. 2024. PMID: 38907911
-
NASBA: a novel, isothermal detection technology for qualitative and quantitative HIV-1 RNA measurements.Clin Lab Med. 1996 Mar;16(1):89-103. Clin Lab Med. 1996. PMID: 8867585 Review.
Cited by
-
Point-of-care diagnostics for infectious diseases: From methods to devices.Nano Today. 2021 Apr;37:101092. doi: 10.1016/j.nantod.2021.101092. Epub 2021 Feb 6. Nano Today. 2021. PMID: 33584847 Free PMC article. Review.
-
Detection of 14 High-Risk Human Papillomaviruses Using Digital LAMP Assays on a Self-Digitization Chip.Anal Chem. 2021 Feb 16;93(6):3266-3272. doi: 10.1021/acs.analchem.0c04973. Epub 2021 Feb 3. Anal Chem. 2021. PMID: 33534543 Free PMC article.
-
Sensitive and Quantitative Point-of-Care HIV Viral Load Quantification from Blood Using a Power-Free Plasma Separation and Portable Magnetofluidic Polymerase Chain Reaction Instrument.Anal Chem. 2023 Jan 17;95(2):1159-1168. doi: 10.1021/acs.analchem.2c03897. Epub 2022 Dec 23. Anal Chem. 2023. PMID: 36562405 Free PMC article.
-
Application of Lab-on-Chip for Detection of Microbial Nucleic Acid in Food and Environment.Front Microbiol. 2021 Nov 4;12:765375. doi: 10.3389/fmicb.2021.765375. eCollection 2021. Front Microbiol. 2021. PMID: 34803990 Free PMC article. Review.
-
Precision Medicine in Low- and Middle-Income Countries.Annu Rev Pathol. 2022 Jan 24;17:387-402. doi: 10.1146/annurev-pathol-042320-034052. Annu Rev Pathol. 2022. PMID: 35073168 Free PMC article. Review.
References
Publication types
MeSH terms
Substances
Grants and funding
LinkOut - more resources
Full Text Sources
Other Literature Sources