. 2018 Dec 1;141(12):3443-3456.
doi: 10.1093/brain/awy264.

Atrophy subtypes in prodromal Alzheimer's disease are associated with cognitive decline

Affiliations

Atrophy subtypes in prodromal Alzheimer's disease are associated with cognitive decline

Mara Ten Kate et al. Brain. .

Abstract

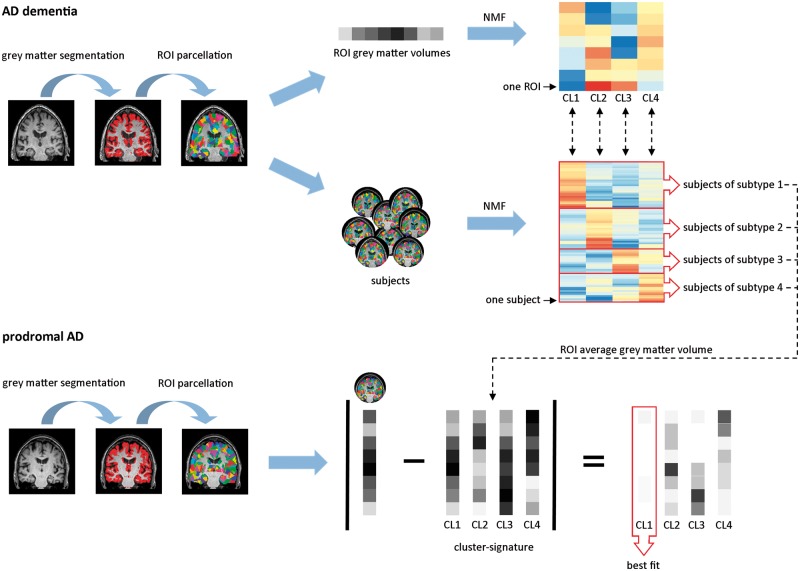
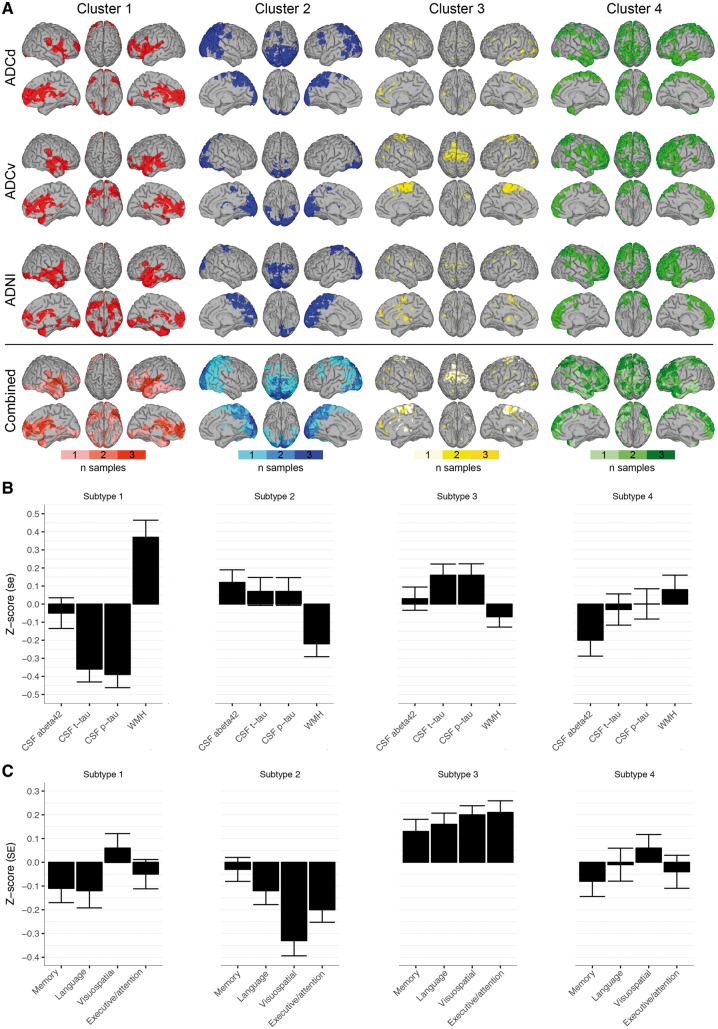
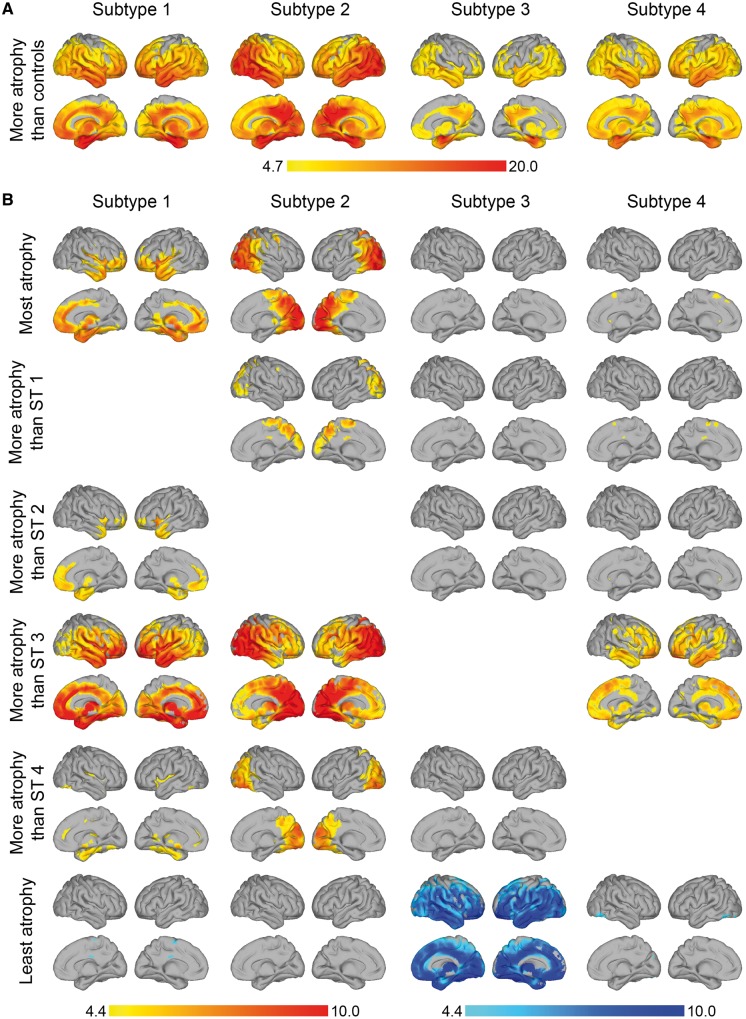
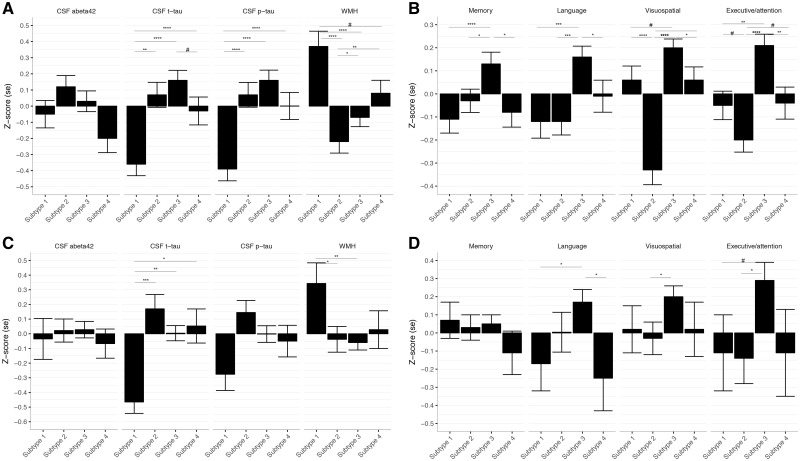
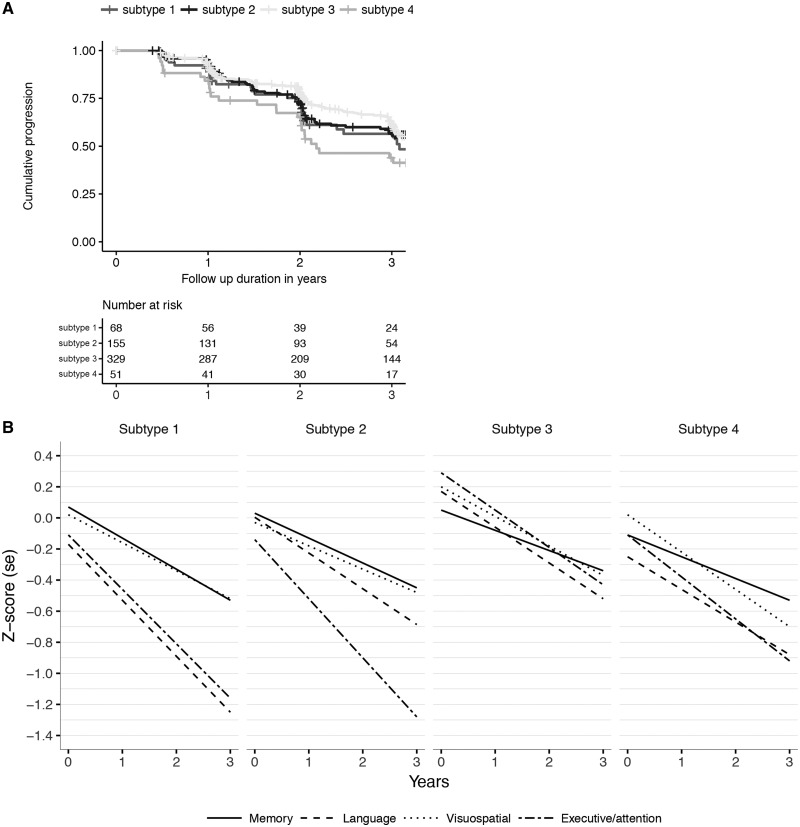
Alzheimer's disease is a heterogeneous disorder. Understanding the biological basis for this heterogeneity is key for developing personalized medicine. We identified atrophy subtypes in Alzheimer's disease dementia and tested whether these subtypes are already present in prodromal Alzheimer's disease and could explain interindividual differences in cognitive decline. First we retrospectively identified atrophy subtypes from structural MRI with a data-driven cluster analysis in three datasets of patients with Alzheimer's disease dementia: discovery data (dataset 1: n = 299, age = 67 ± 8, 50% female), and two independent external validation datasets (dataset 2: n = 181, age = 66 ± 7, 52% female; dataset 3: n = 227, age = 74 ± 8, 44% female). Subtypes were compared on clinical, cognitive and biological characteristics. Next, we classified prodromal Alzheimer's disease participants (n = 603, age = 72 ± 8, 43% female) according to the best matching subtype to their atrophy pattern, and we tested whether subtypes showed cognitive decline in specific domains. In all Alzheimer's disease dementia datasets we consistently identified four atrophy subtypes: (i) medial-temporal predominant atrophy with worst memory and language function, older age, lowest CSF tau levels and highest amount of vascular lesions; (ii) parieto-occipital atrophy with poor executive/attention and visuospatial functioning and high CSF tau; (iii) mild atrophy with best cognitive performance, young age, but highest CSF tau levels; and (iv) diffuse cortical atrophy with intermediate clinical, cognitive and biological features. Prodromal Alzheimer's disease participants classified into one of these subtypes showed similar subtype characteristics at baseline as Alzheimer's disease dementia subtypes. Compared across subtypes in prodromal Alzheimer's disease, the medial-temporal subtype showed fastest decline in memory and language over time; the parieto-occipital subtype declined fastest on executive/attention domain; the diffuse subtype in visuospatial functioning; and the mild subtype showed intermediate decline in all domains. Robust atrophy subtypes exist in Alzheimer's disease with distinct clinical and biological disease expression. Here we observe that these subtypes can already be detected in prodromal Alzheimer's disease, and that these may inform on expected trajectories of cognitive decline.


Figures

Figure 1
Figure 1
NMF in ADD patients and classification of prodromal Alzheimer’s disease participants. Grey matter segmentations were extracted from structural MRI and parcellated into 1024 equally-sized regions of interest, from which regional grey matter volumes were derived (for illustrative purposes only eight regions of interest are shown). In ADD patients, NMF, a dual-clustering approach, was used to identify clusters of features (in this case atrophy patterns) and participants at the same time. Top right: The regions of interest are clustered into distinct atrophy patterns. Each row represents a region of interest and each column an atrophy cluster. The warmer the colour, the more that region of interest contributes to the atrophy cluster. Middle: Subjects are grouped into subtypes based on the best fit of their region of interest volumes to each of the atrophy clusters. Each row represents one participant and the warmer the colour, the better the fit of that participants’ region of interest volumes to the region of interest volumes of that atrophy cluster. For each of the atrophy clusters, we made a cluster signature by computing the average volume in each of the top cluster-defining regions of interest across all ADD patients classified as that atrophy subtype. We classified prodromal Alzheimer’s disease participants based on the lowest absolute minimal distance between their own region of interest volumes and that of the cluster-signatures. AD = Alzheimer’s disease; CL = cluster; ROI = region of interest.
Figure 2
Figure 2
Cluster features across datasets. (A) In each dataset we visualized the top 100 most important cluster-defining features. The bottom row represents the combined important cluster features across datasets: colour bars indicate whether the top 100 cluster-defining features were observed in 1/3, 2/3 or 3/3 datasets. Right hemisphere is displayed on the left side and vice versa. (B) Subtype-specific biomarker profiles: mean ± standard error (SE) of normalized values (z-scores) of CSF levels of amyloid-β1-42 (abeta42), t-tau and p-tau and WMH. (C) Subtype-specific cognitive profiles: mean ± SE of normalized values (z-scores) of neuropsychological composite scores for memory, language, visuospatial and executive/attention domains.
Figure 3
Figure 3
Atrophy patterns in each subtype. (A) Voxel-based morphometry comparison between atrophy subtypes and control (cognitively normal, amyloid negative) participants. (B) Voxel-based morphometry comparison between atrophy subtypes. Top row: In yellow-red regions where each subtype has most atrophy compared to all other clusters. Rows 2–5: In yellow-red pairwise comparisons between subtypes. Bottom row: In blue regions where each subtype has least atrophy (most grey matter) compared to all other subtypes. Colour bar represents t-statistic. Data are presented at voxel-level PFWE < 0.05. Right hemisphere is displayed on the left side and vice versa. ST1 = subtype 1 (medial-temporal dominant atrophy); ST2 = subtype 2 (parieto-occipital atrophy); ST3 = subtype 3 (mild atrophy); ST4 = subtype 4 (diffuse atrophy).
Figure 4
Figure 4
Biomarker and cognitive profile comparisons between subtypes. Data are presented as mean ± SE normalized values (z-scores). P-values are based on ANOVA tests. For neuropsychology, composite scores are presented. Abeta42 = amyloid-β1-42. (A) Biomarker profile comparisons between subtypes in ADD. (B) Cognitive profile comparisons between subtypes in ADD. (C) Biomarker profile comparisons between subtypes in prodromal Alzheimer’s disease. (D) Cognitive profile comparisons between subtypes in prodromal Alzheimer’s disease. Subtype 1 = medial-temporal atrophy; subtype 2 = parieto-occipital atrophy; subtype 3 = mild atrophy; subtype 4 = diffuse cortical atrophy.
Figure 5
Figure 5
Disease progression in prodromal Alzheimer’s disease for each of the four atrophy subtypes. (A) Progression curves for time to dementia onset within 3 years. (B) Decline over time in cognitive functioning in memory, language, visuospatial functioning and executive/attention plotted per subtype. Subtype 1 = medial-temporal atrophy; subtype 2 = parieto-occipital atrophy; subtype 3 = mild atrophy; subtype 4 = diffuse cortical atrophy.

Comment in

References

    1. Blennow K, Mattsson N, Schöll M, Hansson O, Zetterberg H. Amyloid biomarkers in Alzheimer’s disease. Trends Pharmacol Sci 2015; 36: 297–309. - PubMed
    1. Byun MS, Kim SE, Park J, Yi D, Choe YM, Sohn BK, et al. . Heterogeneity of regional brain atrophy patterns associated with distinct progression rates in Alzheimer’s disease. PLoS One 2015; 10: e0142756-16. - PMC - PubMed
    1. Dice L. Measures of the amount of ecologic association between species. Ecology 1945; 26: 297–302.
    1. Dong A, Toledo JB, Honnorat N, Doshi J, Varol E, Sotiras A, et al. . Heterogeneity of neuroanatomical patterns in prodromal Alzheimer’s disease: links to cognition, progression and biomarkers. Brain 2017; 140: 735–47. - PMC - PubMed
    1. Dubois B, Feldman HH, Jacova C, Hampel H, Molinuevo JL, Blennow K, et al. . Advancing research diagnostic criteria for Alzheimer’s disease: the IWG-2 criteria. Lancet Neurol 2014; 13: 614–29. - PubMed

Publication types