. 2019 Nov 27;20(6):2185-2199.
doi: 10.1093/bib/bby079.

Computational analysis and prediction of lysine malonylation sites by exploiting informative features in an integrative machine-learning framework

Affiliations

Computational analysis and prediction of lysine malonylation sites by exploiting informative features in an integrative machine-learning framework

Yanju Zhang et al. Brief Bioinform. .

Abstract

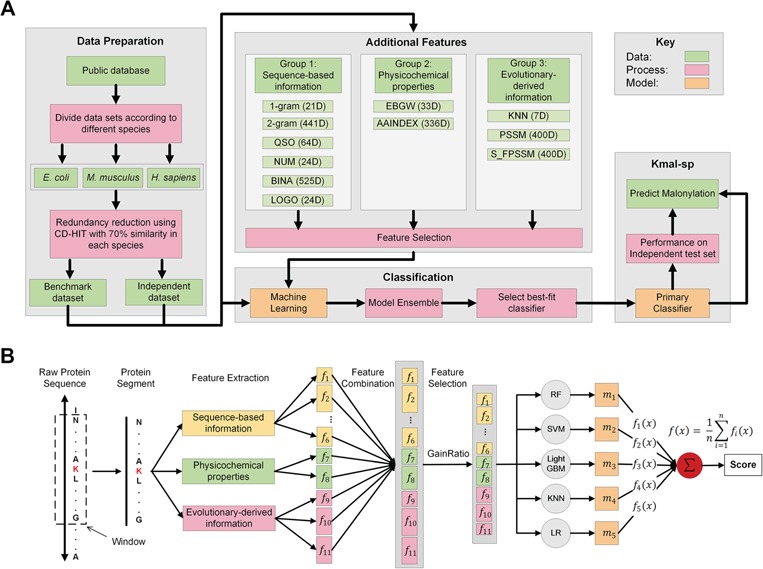
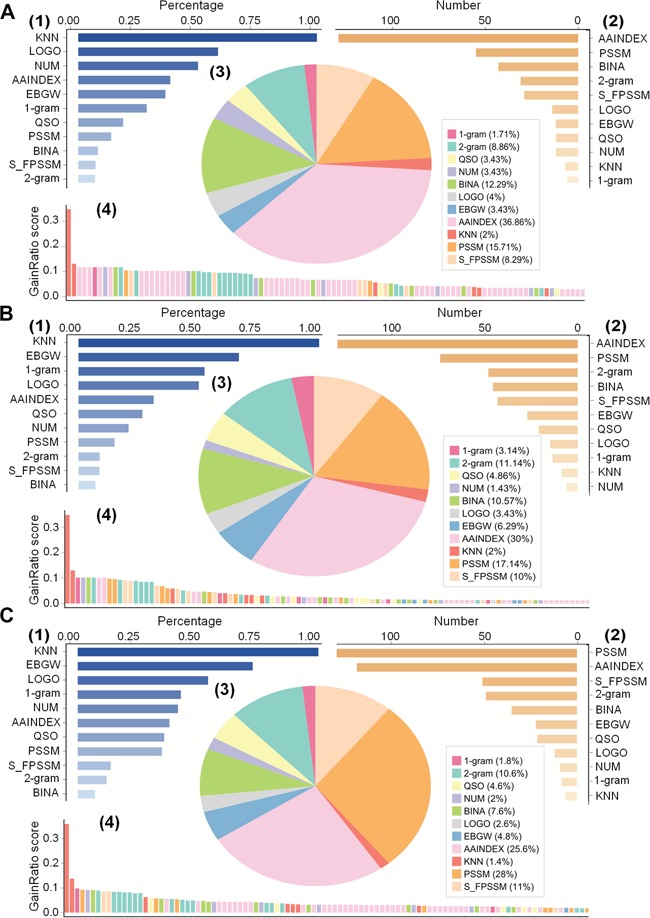
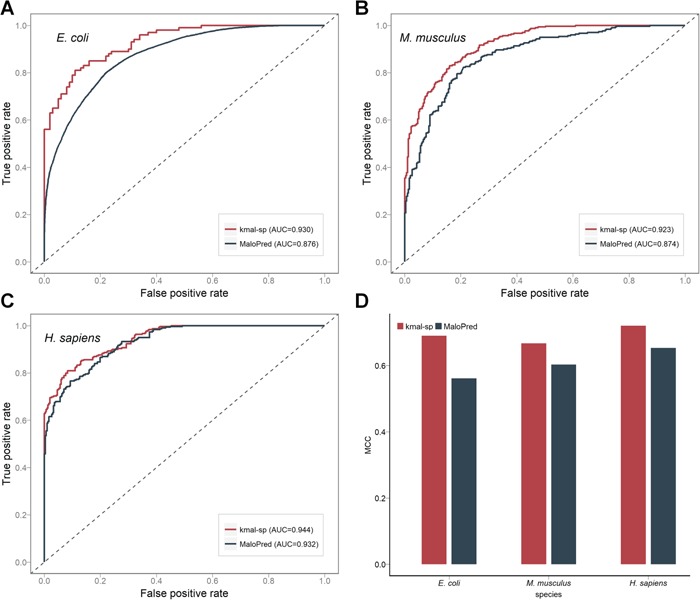
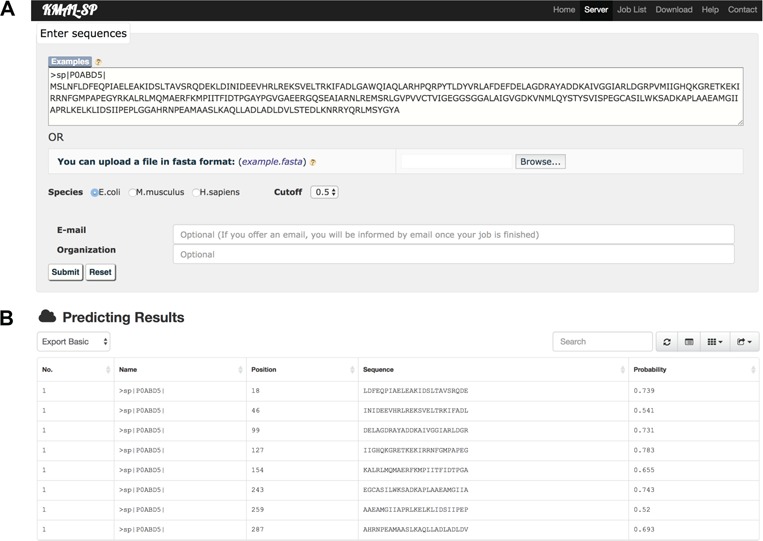
As a newly discovered post-translational modification (PTM), lysine malonylation (Kmal) regulates a myriad of cellular processes from prokaryotes to eukaryotes and has important implications in human diseases. Despite its functional significance, computational methods to accurately identify malonylation sites are still lacking and urgently needed. In particular, there is currently no comprehensive analysis and assessment of different features and machine learning (ML) methods that are required for constructing the necessary prediction models. Here, we review, analyze and compare 11 different feature encoding methods, with the goal of extracting key patterns and characteristics from residue sequences of Kmal sites. We identify optimized feature sets, with which four commonly used ML methods (random forest, support vector machines, K-nearest neighbor and logistic regression) and one recently proposed [Light Gradient Boosting Machine (LightGBM)] are trained on data from three species, namely, Escherichia coli, Mus musculus and Homo sapiens, and compared using randomized 10-fold cross-validation tests. We show that integration of the single method-based models through ensemble learning further improves the prediction performance and model robustness on the independent test. When compared to the existing state-of-the-art predictor, MaloPred, the optimal ensemble models were more accurate for all three species (AUC: 0.930, 0.923 and 0.944 for E. coli, M. musculus and H. sapiens, respectively). Using the ensemble models, we developed an accessible online predictor, kmal-sp, available at http://kmalsp.erc.monash.edu/. We hope that this comprehensive survey and the proposed strategy for building more accurate models can serve as a useful guide for inspiring future developments of computational methods for PTM site prediction, expedite the discovery of new malonylation and other PTM types and facilitate hypothesis-driven experimental validation of novel malonylated substrates and malonylation sites.

Keywords: Light Gradient Boosting Machine; computational prediction; ensemble learning; feature encoding methods; lysine malonylation; machine learning.


Figures

Figure 1
Figure 1
The overall framework of kmal-sp: (A) An outline of the overall flowchart of the kmal-sp methodology. (B) An illustration of the detailed procedures for constructing the prediction models for each species. First, the collected protein sequences are split into segments with a length (window size) of 25 residues each. Based on these segments, 11 different types of features are extracted that characterize Kmal sites in different aspects (these features are categorized into three main groups). Second, the optimal feature set is selected by applying the GainRatio method to the combined feature set. Based on the optimal feature set, we train the prediction models using several different ML algorithms and also exploit the integration of individual algorithm-based models into ensemble models. Finally, the optimal ensemble model is generated and applied to predict potential Kmal sites with improved accuracy.
Figure 2
Figure 2
Sequence characteristics of Kmal sites across the three species. Panels (A), (B) and (C) illustrate the over-represented and under-represented amino acid occurrences in the segments flanking the central Kmal sites of E. coli, M. musculus and H. sapiens, respectively. Sequence logo representations were generated by Two Sample Logo with t-test (P < .05). Panel (D) represents distributions of the sequential distances between malonylation and non-malonylation segments within the same protein sequences.
Figure 3
Figure 3
Performance comparison of the RF models trained using 11 different feature types based on 10-time 10-fold cross-validation tests for E. coli, M. musculus and H. sapiens. Randomized 10-fold cross-validation tests were conducted 10 times. The final performance of the RF models was averaged over the 10 times, with the standard error calculated and shown in bars.
Figure 4
Figure 4
Performance comparison of RF models trained using different feature sets across the three species. Each feature set was assessed by applying GainRatio (‘gr’) to the original feature sets. Ten-fold cross-validation tests were randomly performed 10 times, and the performance was averaged with calculated standard deviations. Red stars denote the feature set with the overall best performance for the corresponding species, while blue circles represent the original feature set, prior to feature selection.
Figure 5
Figure 5
Distribution analysis of generated optimal feature sets across the three species. Panels (A), (B) and (C) illustrate distributions of feature types included in the optimal feature sets for E. coli, M. musculus and H. sapiens, respectively. In each panel (A, B and C), (1) and (2) show the percentage and the number, respectively, of each feature type selected in the optimal feature set, (3) depicts the proportion of the types of features selected in the optimal feature set while (4) provides the GainRatio score for the top 100 selected features in the optimal feature set.
Figure 6
Figure 6
Performance comparison between our proposed method kmal-sp and the state-of-the-art method MaloPred for predicting malonylation sites. (A), (B) and (C) ROC curves of both methods on the independent test for predicting malonylation sites of E. coli, M. musculus, and H. sapiens, respectively. (D) histograms showing the performance of kmal-sp and MaloPred in terms of MCC on the independent test.
Figure 7
Figure 7
Screenshot of the online web server kmal-sp: (A) the user submission interface and (B) the predicted result for a case study protein sequence as input.

Similar articles

Cited by

References

    1. Gallego M, Virshup DM. Post-translational modifications regulate the ticking of the circadian clock. Nat Rev Mol Cell Biol 2007;8:139–48. - PubMed
    1. Westermann S, Weber K. Post-translational modifications regulate microtubule function. Nat Rev Mol Cell Biol 2003;4:938–47. - PubMed
    1. Harmel R, Fiedler D. Features and regulation of non-enzymatic post-translational modifications. Nat Chem Biol 2018;14:244–52. - PubMed
    1. Johnson LN. The regulation of protein phosphorylation. Biochem Soc Trans 2009;37:627–41. - PubMed
    1. Ambler RP, Rees MW. Epsilon-N-Methyl-lysine in bacterial flagellar protein. Nature 1959;183:1654–5. - PubMed

Publication types