. 2018 Oct 23;13(10):e0199341.
doi: 10.1371/journal.pone.0199341. eCollection 2018.

Restoring striatal WAVE-1 improves maze exploration performance of GluN1 knockdown mice

Affiliations

Restoring striatal WAVE-1 improves maze exploration performance of GluN1 knockdown mice

Yuxiao Chen et al. PLoS One. .

Abstract

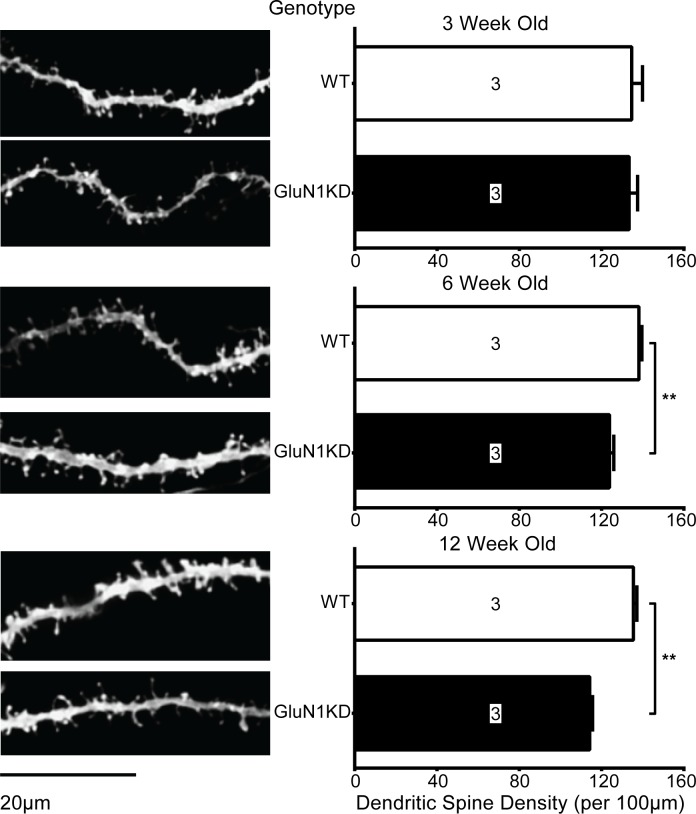
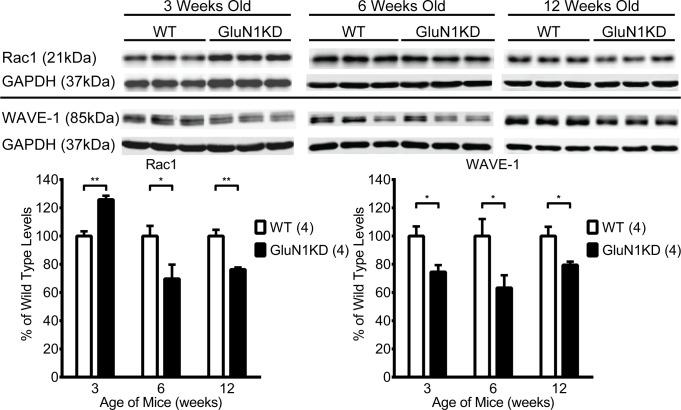
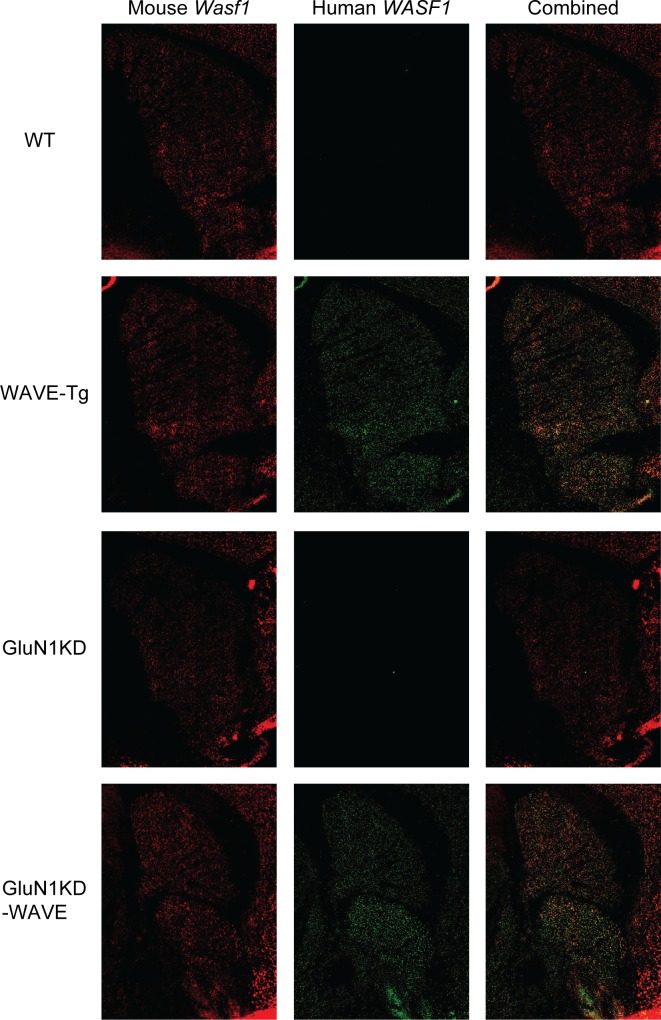
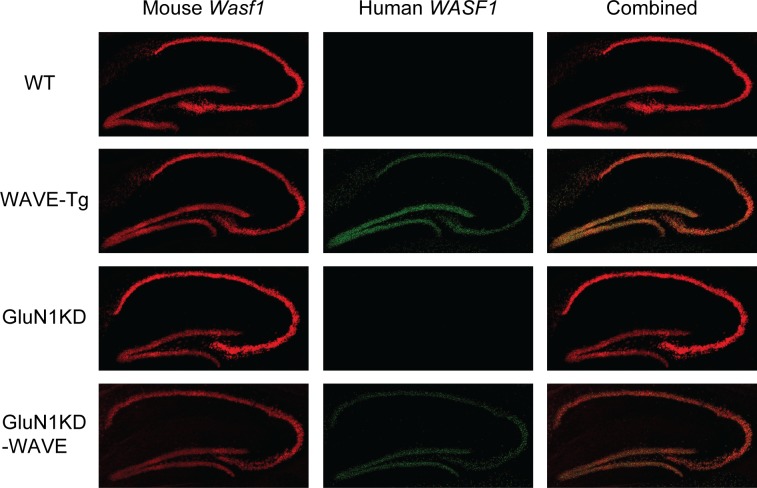
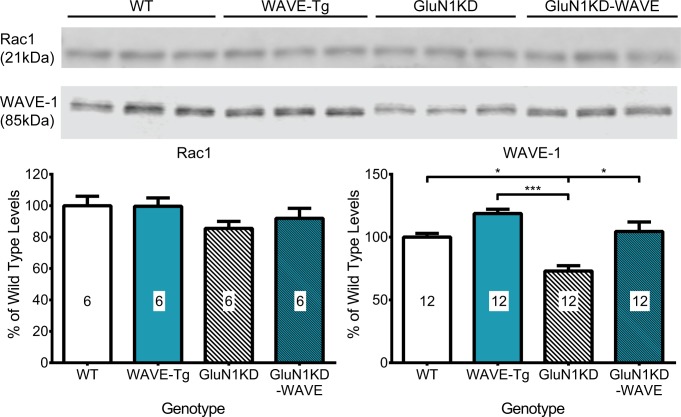
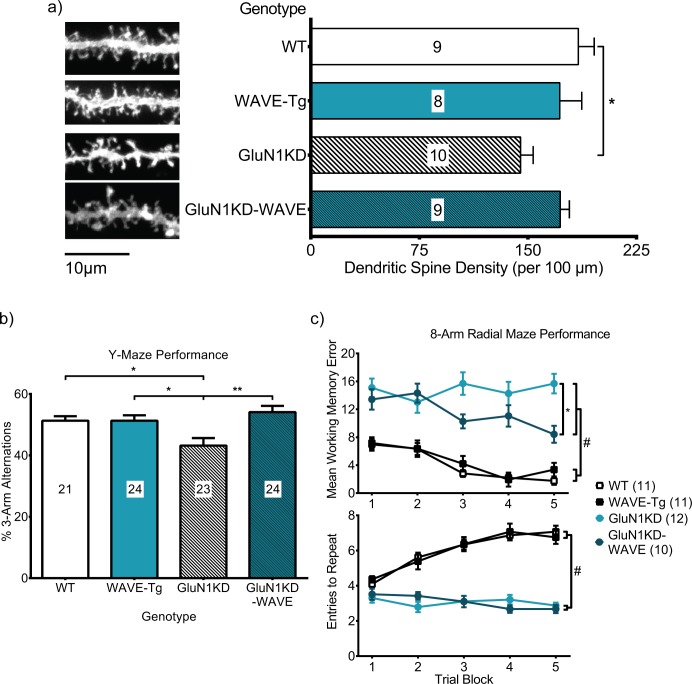
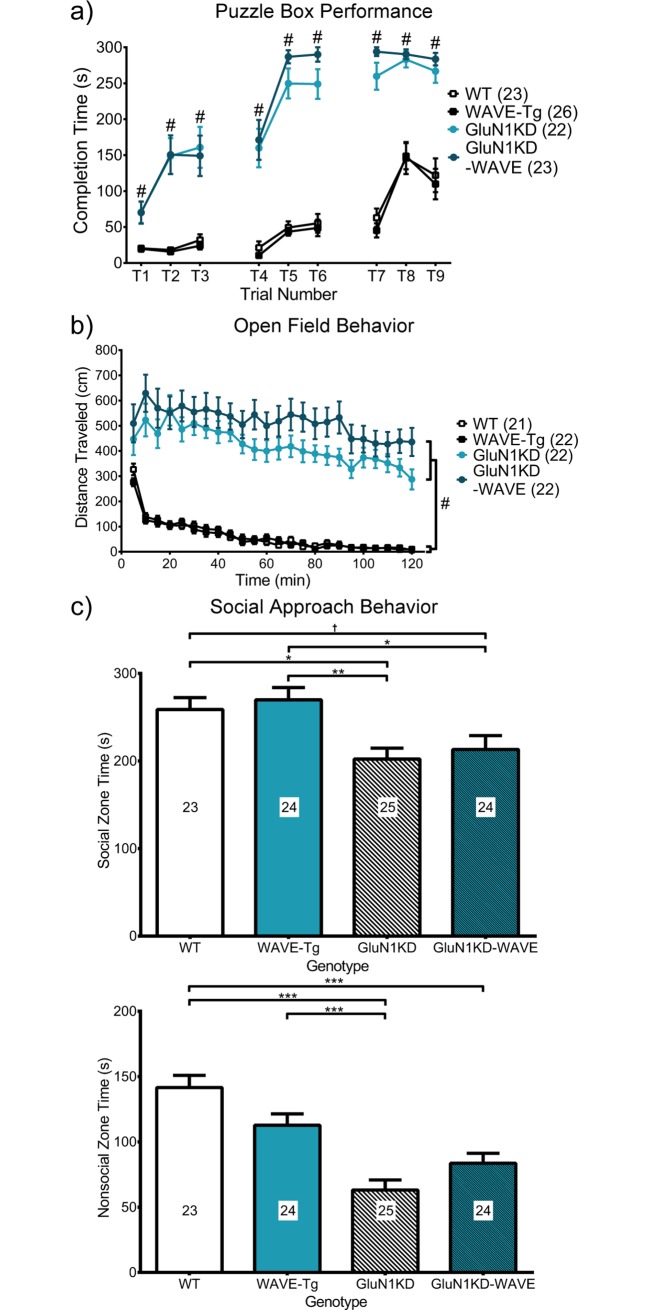
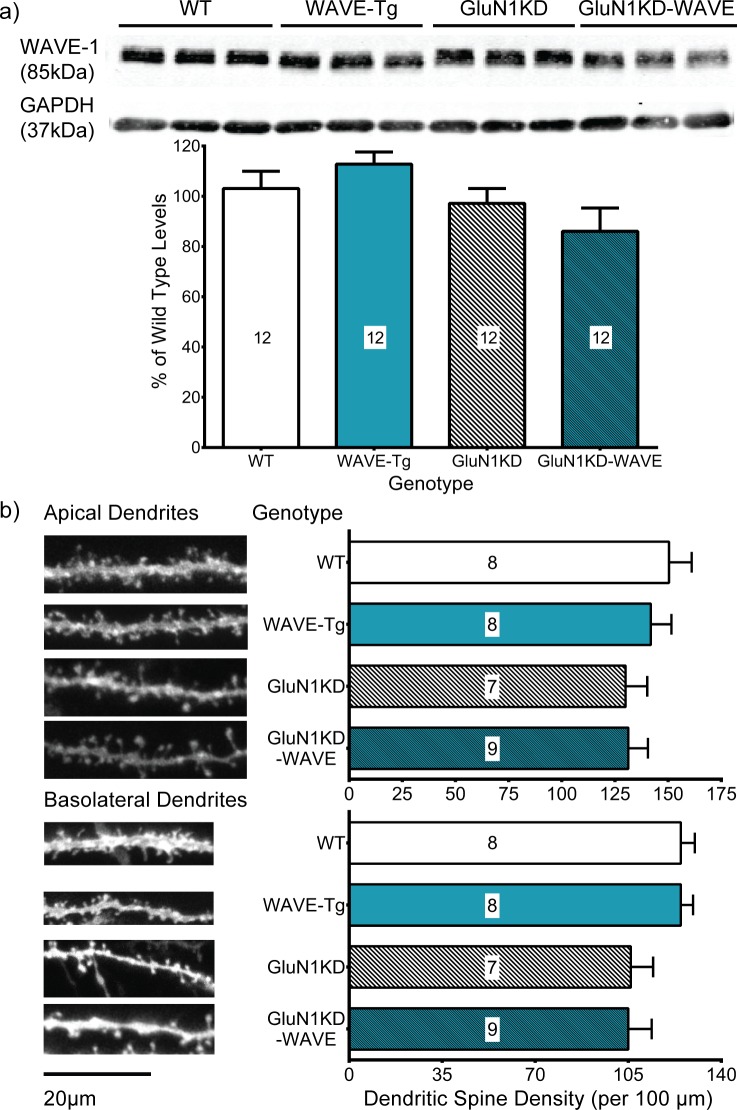
NMDA receptors are important for cognition and are implicated in neuropsychiatric disorders. GluN1 knockdown (GluN1KD) mice have reduced NMDA receptor levels, striatal spine density deficits, and cognitive impairments. However, how NMDA depletion leads to these effects is unclear. Since Rho GTPases are known to regulate spine density and cognition, we examined the levels of RhoA, Rac1, and Cdc42 signaling proteins. Striatal Rac1-pathway components are reduced in GluN1KD mice, with Rac1 and WAVE-1 deficits at 6 and 12 weeks of age. Concurrently, medium spiny neuron (MSN) spine density deficits are present in mice at these ages. To determine whether WAVE-1 deficits were causal or compensatory in relation to these phenotypes, we intercrossed GluN1KD mice with WAVE-1 overexpressing (WAVE-Tg) mice to restore WAVE-1 levels. GluN1KD-WAVE-Tg hybrids showed rescue of striatal WAVE-1 protein levels and MSN spine density, as well as selective behavioral rescue in the Y-maze and 8-arm radial maze tests. GluN1KD-WAVE-Tg mice expressed normalized WAVE-1 protein levels in the hippocampus, yet spine density of hippocampal CA1 pyramidal neurons was not significantly altered. Our data suggest a nuanced role for WAVE-1 effects on cognition and a delineation of specific cognitive domains served by the striatum. Rescue of striatal WAVE-1 and MSN spine density may be significant for goal-directed exploration and associated long-term memory in mice.


Conflict of interest statement

The authors have declared that no competing interests exist.

Figures

Fig 1
Fig 1
Representative images (left) and quantifications (right) of dendritic spines of striatal MSNs in male and female GluN1KD and WT mice at 3, 6, and 12 weeks of age. GluN1KD mice have significantly reduced spine density compared to WT mice at 6 and 12 weeks of age. Mouse sample sizes are denoted within each bar. 3–7 dendrite sample images were analyzed for each mouse. Scale bar represents 20μm. Data was analyzed by two-tailed, independent t-tests, ** p < 0.01.
Fig 2
Fig 2
Representative western blots (top) and their quantifications (bottom) assessing differences in Rac1 and WAVE-1 levels at the striatum of male and female GluN1KD mice and WT littermates aged 3, 6, and 12 weeks. In GluN1KD mice, Rac1 was significantly increased at 3 weeks before decreasing to lower than WT levels at 6 and 12 weeks of age. In contrast, WAVE-1 was consistently decreased at all time points. All blots were first normalized to GAPDH loading controls. A sample size of 4 mice per group, denoted in the graph legends beside genotype labels, was used for every genotype and age group. Data was analyzed by two-tailed, independent t-tests, * p ≤ 0.05, ** p < 0.01.
Fig 3
Fig 3. Relative copy number of the WASF1/Wasf1 gene in non-transgenic and different generations of WASF1-transgenic mice of both sexes.
Transgenic mice, regardless of Grin1 genotype, generally had 10–11 copies of the WASF1/Wasf1 gene. Gene copy number was consistent between different generations of transgenic mice. Mouse sample sizes are denoted within each bar. Data was analyzed by Kruskal-Wallis test followed by post hoc Dunn’s multiple comparisons for all pairings, * p < 0.01 for all comparisons between non-transgenic mice and a transgenic mouse group.
Fig 4
Fig 4. Fluorescent in situ hybridization of male WT, WAVE-Tg, GluN1KD, and GluN1KD-WAVE striatum.
Endogenous, mouse Wasf1 message is shown in red (left column) while transgenic, human WASF1 is shown in green (middle column). Human WASF1 was expressed abundantly and specifically in transgenic mice with a pattern of expression similar to mouse Wasf1.
Fig 5
Fig 5. Fluorescent in situ hybridization of male WT, WAVE-Tg, GluN1KD, and GluN1KD-WAVE hippocampus.
Endogenous, mouse Wasf1 message is shown in red (left column) while transgenic, human WASF1 is shown in green (middle column). Human WASF1 was expressed abundantly and specifically in transgenic mice with a pattern of expression similar to mouse Wasf1.
Fig 6
Fig 6
Representative western blots (top) and their quantifications (bottom) assessing differences in striatal levels of Rac1 and WAVE-1 of adult male and female, WT, WAVE-Tg, GluN1KD, and GluN1KD-WAVE mice. WAVE-1 was confirmed to be decreased in GluN1KD mice, increased in WAVE-Tg mice, and attenuated towards WT levels in GluN1KD-WAVE mice. No sex differences were observed for striatal WAVE-1 levels (S1 Table). Rac1 was not found to be significantly different between genotypes. A sample size of 6 mice was used for every genotype. Data was analyzed by one-way ANOVAs followed by Bonferroni post hoc comparisons for all pairings, # p = 0.09, * p < 0.05, ** p < 0.01.
Fig 7
Fig 7
Striatal MSN spine density (a), Y-maze performance (b), and 8-arm radial maze performance (c) are deficient in GluN1KD mice and improved in GluN1KD-WAVE mice. a) Representative images of MSN dendrites (left) and spine density quantifications (right) show lower spine density in GluN1KD mice compared to WT littermates but not in GluN1KD-WAVE hybrids. Mouse sample sizes are denoted within each bar. Male mice were used in this experiment. 3–6 dendrite sample images were analyzed for each mouse. Scale bar represents 20μm. Data was analyzed by Kruskal-Wallis test followed by Dunn’s multiple comparisonsfor all pairings, * p = 0.048. b) GluN1KD, but not GluN1KD-WAVE, mice had significantly lower % 3-arm alternation scores compared to WT and WAVE-Tg mice. GluN1KD-WAVE mice also had a significantly higher score compared to GluN1KD mice. Data was analyzed by one-way ANOVA followed by Bonferroni post hoc comparisons for all pairings, * p < 0.05, ** p < 0.01. Sample sizes are indicated by numbers in each bar. c) Mean WME (top) and ETR (bottom) scores from the 8-arm radial maze test show different effects of intercrossing GluN1KD and WAVE-Tg mice. GluN1KD and GluN1KD-WAVE mice performed worse on both measures compared to WT and WAVE-Tg mice, but GluN1KD-WAVE mice also had significantly less WMEs over the course of the experiment compared to GluN1KD mice. Two-way repeated measures ANOVAs reported significant effects of genotype on both WME and ETR (p < 0.01). # Bonferroni post hoc analysis reported an adjusted p < 0.01 for each comparison between a GluN1KD and a non-GluN1KD genotype. * p = 0.02 for GluN1KD-WAVE mice WMEs compared to GluN1KD mice. In the context of 8-arm radial maze WMEs, intercrossing GluN1KD and WAVE-Tg mice resulted in a partial rescue. Male and female mice were used in behavioral experiments. No gene-sex interaction effects were observed in these behavior tests, thought male mice did perform better than female littermates in the Y-maze test (S1 Table). Sample sizes are indicated next to their respective genotypes in the legend.
Fig 8
Fig 8
Performance of WT, WAVE-Tg, GluN1KD and GluN1KD-WAVE mice in the (a) puzzle box, (b) open field and (c) social approach behavior tests. a) Mice with GluN1KD genotypes took significantly longer to complete puzzle box trials compared to non-GluN1KD mice. Data for each trial was analyzed by independent sample Kruskal-Wallis tests followed by post hoc Dunn’s multiple comparisons. # indicates a significant effect of genotype on test completion speed rankings with p ≤ 0.015 for each comparison between a GluN1KD genotype and a non-GluN1KD genotype for each trial. GluN1KD and GluN1KD-WAVE mice did not differ significantly in any of the puzzle box trials. Sample sizes are indicated next to their respective genotypes in the graph legend. b) Distance traveled over time was recorded in the open field test. Mice of GluN1KD genotypes travelled greater distances and did not display habituation compared to non-GluN1KD littermates. Two-way repeated measures ANOVAs reported a significant main effect of genotype (p < 0.01). # Bonferroni post hoc analyses reported p < 0.01 for each comparison between a GluN1KD and a non-GluN1KD genotype. No significant differences were found between GluN1KD and GluN1KD-WAVE mice. Sample sizes are next to each genotype in the graph legend. c) GluN1KD mice spent less time in the social zone, which contained a social stimulus mouse, compared to non-GluN1KD mice. GluN1KD-WAVE mice scored significantly lower compared to WAVE-Tg mice and trended towards significance compared to WT mice († p = 0.15). WT mice also spent more time in the nonsocial zone compared to both GluN1KD and GluN1KD-WAVE mice. No significance was found comparing GluN1KD to GluN1KD-WAVE mice. Male and female mice were used in all behavioral experiments. No sex differences were observed in these behavior tests (S1 Table). Data was analyzed by one-way ANOVA followed by Bonferroni post hoc comparisons for all pairings, * p < 0.05, ** p < 0.01. Sample sizes are indicated in each bar. Intercrossing GluN1KD and WAVE-Tg mice did not result in improved performance in the puzzle box, open field, or social approach behavior tests.
Fig 9
Fig 9
(a) Hippocampal WAVE-1 western blots and (b) CA1 pyramidal neuron spine density analyses in male WT, WAVE-Tg, GluN1KD and GluN1KD-WAVE mice. a) Representative western blots are shown on top with their quantifications below. Compared to WT mice, WAVE-1 was not significantly changed in WAVE-Tg, GluN1KD, or GluN1KD-WAVE mice. All blots were first normalized to GAPDH loading control bands before analysis. A sample size of 6 mice was used for every genotype. Data was analyzed by one-way ANOVA followed by Bonferroni post hoc comparisons for all pairings. No sex differences were observed in hippocampal WAVE-1 protein levels (S1 Table). b) Apical (top) and basolateral (bottom) dendritic spine analyses are shown with representative dendrite images on the left and spine density quantifications on the right. GluN1KD mice had less apical and basolateral spines compared to non-GluN1KD mice, but these differences were not significant. Mouse sample sizes are denoted within each bar. 3–6 dendrite sample images were analyzed for each mouse. Scale bars represents 20μm. Data was analyzed by Kruskal-Wallis tests.

References

    1. Paoletti P, Bellone C, Zhou Q. NMDA receptor subunit diversity: impact on receptor properties, synaptic plasticity and disease. Nat Rev Neurosci. 2013;14: 383–400. 10.1038/nrn3504 - DOI - PubMed
    1. Yuan H, Low C-M, Moody OA, Jenkins A, Traynelis SF. Ionotropic GABA and Glutamate Receptor Mutations and Human Neurologic Diseases. Mol Pharmacol. 2015;88: 203–217. 10.1124/mol.115.097998 - DOI - PMC - PubMed
    1. Mohn AR, Gainetdinov RR, Caron MG, Koller BH. Mice with Reduced NMDA Receptor Expression Display Behaviors Related to Schizophrenia. Cell. 1999;98: 427–436. 10.1016/S0092-8674(00)81972-8 - DOI - PubMed
    1. Dzirasa K, Ramsey AJ, Takahashi DY, Stapleton J, Potes JM, Williams JK, et al. Hyperdopaminergia and NMDA Receptor Hypofunction Disrupt Neural Phase Signaling. J Neurosci. 2009;29: 8215–8224. 10.1523/JNEUROSCI.1773-09.2009 - DOI - PMC - PubMed
    1. Gandal MJ, Anderson RL, Billingslea EN, Carlson GC, Roberts TPL, Siegel SJ. Mice with reduced NMDA receptor expression: more consistent with autism than schizophrenia? Genes Brain Behav. 2012;11: 740–750. 10.1111/j.1601-183X.2012.00816.x - DOI - PMC - PubMed

Publication types

MeSH terms