. 2019 Jan:144:155-171.
doi: 10.1016/j.neuropharm.2018.10.027. Epub 2018 Oct 21.

Muscarinic receptors regulate auditory and prefrontal cortical communication during auditory processing

Affiliations

Muscarinic receptors regulate auditory and prefrontal cortical communication during auditory processing

Nicholas M James et al. Neuropharmacology. 2019 Jan.

Abstract

Much of our understanding about how acetylcholine modulates prefrontal cortical (PFC) networks comes from behavioral experiments that examine cortical dynamics during highly attentive states. However, much less is known about how PFC is recruited during passive sensory processing and how acetylcholine may regulate connectivity between cortical areas outside of task performance. To investigate the involvement of PFC and cholinergic neuromodulation in passive auditory processing, we performed simultaneous recordings in the auditory cortex (AC) and PFC in awake head fixed mice presented with a white noise auditory stimulus in the presence or absence of local cholinergic antagonists in AC. We found that a subset of PFC neurons were strongly driven by auditory stimuli even when the stimulus had no associative meaning, suggesting PFC monitors stimuli under passive conditions. We also found that cholinergic signaling in AC shapes the strength of auditory driven responses in PFC, by modulating the intra-cortical sensory response through muscarinic interactions in AC. Taken together, these findings provide novel evidence that cholinergic mechanisms have a continuous role in cortical gating through muscarinic receptors during passive processing and expand traditional views of prefrontal cortical function and the contributions of cholinergic modulation in cortical communication.

Keywords: Acetylcholine; Auditory cortex; Cortical gating; Prefrontal cortex; Sensory processing.


Figures

Fig. 1.
Fig. 1.. Experimental paradigm.
A: Head fixed mouse preparation with electrode and optical fiber placements during recording. One 16-channel electrode was positioned in PFC, an infusion pipette positioned between the two inner shanks of a 32 channel, 4 shank recording electrode in AC, and a shielded optical fiber in nucleus basalis (NB). B: Anatomical location of recording electrodes and infusion pipette represented in a frontal (PFC) and horizontal section (AC). PFC single shank penetration occurred along the dorsal-ventral axis with sites facing medially. For the AC array, insertion was at a 30° angle with all recording sites facing medially while the shanks and infuser were situated along the rostral-caudal axis. C (i): Cartoon depiction of electrode and fiber placement for histology sections shown to the right. (ii): Section from AC showing electrode placement for this recording area. (iii): Histology image showing ChR2-GFP expression in tissue co-labeled with antibodies directed against choline acetyl transferase (Chat). Note, ChR2-GFP expression is limited to cells also expressing Chat (red). (iv): Nissl stain showing optical fiber track and placement in NB. (v): Section from frontal cortex demonstrating electrode placement from a representative animal. D: During the preinfusion recording period (block 1), mice were presented with 100 trials of optical stimulation alone and 100 trials of auditory stimulation alone, with the order of trials shuffled throughout the block. A second recording session was performed 30min after drug infusion (block 2). Abbreviations: Cg; Cingulate Cortex, Prl; Prelimbic cortex, IL; Infralimbic Cortex, LSI; CPu; Caudate Putamen, MO; Medial Orbital Cortex, LO; Lateral Orbital Cortex, S1; Primary Somatosensory Cortex, LV; Lateral Ventricle, AuD; Secondary Auditory Cortex Dorsal, A1; Primary Auditory Cortex, AC; Auditory Cortex, PFC; Prefrontal Cortex, nBM; Nucleus Basalis of Meynert, B; Basal Nucleus of Meynert, 3V; Third Ventricle; R; Rostral, C; Caudal, M; Medial, L; Lateral).
Fig. 2.
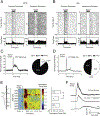
Fig. 2.. Auditory stimuli evoked strong MUA in PFC and AC during passive sound presentation in mice.
A: Example MU from PFC that shows an increase (left) or a decrease (right) in firing rate during the sound stimulus. B: Example MU from AC that shows an increase (left) or a decrease (right) in firing rate during the sound stimulus. C, D: Mean population MUA in PFC (C) and AC (D) during the sound presentation (left) and the proportion of responsive MUs for each region (right). E: Mean normalized PFC MUA from all animals across all depth locations from the pre-infusion condition. Note that all regions show an increase in firing rate with prelimbic (PrL) exhibiting the largest increase in firing rate (* = p < 0.05). F: Mean population MUA from granular and extragranular layers in AC and mean population MUA from the PFC from the pre-infusion period. (Cg; Cingulate Cortex, Prl; Prelimbic cortex, IL; Infralimbic Cortex, MO; Medial Orbital Cortex).
Fig. 3.
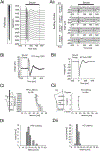
Fig. 3.. Auditory input produced robust ERPs in PFC and AC during passive sound presentation in mice.
A: Representative ERP response to auditory stimuli across all channels in the PFC (i) and AC (ii). B: Population ERP from PFC (i) and AC (ii), in response to auditory stimuli. C: ERP onset latency along the dorsal-ventral axis of PFC (i) and along the rostro-caudal axis of AC (ii). (solid lines are mean, and shaded areas are mean ± s.e.m. D: Histogram of ERP onset latencies from PFC (i) and the granular layers of AC (ii).
Fig. 4.
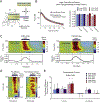
Fig. 4.. Effects of cholinergic antagonism on LFP power and optogenetically induced cortical desynchrony in AC and PFC.
A: Diagram illustrating recording/ infusion configuration in AC in a horizontal section. Compass denotes rotral-caudal and medial-lateral axis. Inner shanks are highlighted yellow and outer shanks are highlighted green. Pipette location is noted in blue. B: Population spectrum of LFP power on inner shanks in AC before (black) and after (red) infusion of high dose scopolamine during the inter-trial interval in the absence of stimuli or optogenetic activation of cholinergic NB (left). Bar height represents population mean ± s.e.m normalized to pre-infusion baseline across all mice recorded (right) and compares ACSF (blue) to scopolamine (red). Outer sites are darkly shaded relative to inner sites (* = p < 0.05). C: Cortical desynchrony produced by optogenetic activation of cholinergic NB. Trial averaged, baseline normalized spectrograms from AC (left) or PFC (right) during optical stimulation. The ratio of low frequency power (1–10 Hz) to high frequency power (10–100 Hz) for AC and PFC is shown below (bottom). D: Population spectrogram of AC LFP during optogenetic activation of cholinergic NB prior to high dose scopolamine infusion (left), and following infusion (right). E: Change in AC LFP power by frequency range during optogenetic stimulation in the presence of antagonists or vehicle. Values are expressed as percentages of pre infusion power (mean ± s.e.m). Outer sites are darkly shaded relative to inner sites (* = p < 0.05).
Fig. 5.
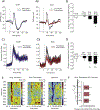
Fig. 5.. Effects of muscarinic blockade on CSD profiles in AC.
A: ERPs in AC overlaid on CSD calculated from laminar ERP in a representative animal. B: Population sound-evoked CSD response from the channel exhibiting the largest thalamocortical response during pre-infusion period (mean ± s.e.m.). Red dotted line represents 0 mV/mm. Zero crossings were used to define an early window (0–72 ms exhibiting granular layer current sinks) and a late window (72–186 ms exhibiting granular layer source). C,D: CSD responses across the four probes before (C) and after high-dose scopolamine infusion (D) separated by shank location. Bar graphs represent the calculated RMS across all channels of the CSD in the early and late windows as defined in (B). Diagram illustrates recording site being shown and placement relative to infusion location in AC. Inner shanks (2&3) are closest to infusion pipette while 1&4 are furthest from the infusion site. Inner shanks are also highlighted yellow and outer shanks are highlighted green. Shank 1 is the most rostral placement while shank 4 is the most caudal. E: CSD response from the channel with the largest thalamocortical response from both inner and outer shanks before (black) scopolamine infusion and after (red) high dose scopolamine infusion (mean ± s.e.m). F: Change in net current of the CSD following cholinergic antagonist or ACSF infusions from the early (left) and late (right) windows. Bar height represents population mean, error bars are ± s.e.m. (* = p < 0.05).
Fig. 6.
Fig. 6.. Endogenous muscarinic signaling modulates the strength of MUA in AC during sound presentation.
A: Diagram illustrating recording/infusion configuration and location of electrodes shown on the right. Inner shanks are highlighted yellow and outer shanks are highlighted green. Granular channels are highlighted. Granular layer MU population responses from inner and outer shanks before (black) and after (red) high dose scopolamine infusion (right) differences relative to the pre-sound firing rate. B: Integrated MUA from the granular layers from the early and late windows identified from CSD analysis (early: 0–72 ms, late 72–180 ms). Bar graphs are differences relative to the pre infusion baseline and represent changes in firing rate following infusion of ACSF or scopolamine (* = p < 0.05). C: Diagram illustrating recording/infusion configuration and location of signals shown on the right. Extragranular channels are highlighted. MUA from extragranular channels on the inner (left) and outer (right) shanks before (black) or after (red) high dose scopolamine infusion. D: Same as B, for extragranular layers. Figures are shown as population mean ± s.e.m. (* = p < 0.05).
Fig. 7.
Fig. 7.. Scopolamine infusion in AC reduced ERP amplitude and spiking activity in PFC.
A: Example sound evoked PFC ERP responses before (black) and after (blue) local infusion of ACSF (i) or high dose scopolamine (red) in AC (ii). Solid lines indicate mean, and shaded areas are mean ± s.e.m. B: ERP amplitude after infusion of different drugs normalized to pre-infusion amplitude. Error bars are ± s.e.m. C: Normalized MUA responses before (black) and after (red) infusion of ACSF (i) or high dose scopolamine (Cii). Lines are mean, and shaded areas are mean ± s.e.m. D: Comparison of the change in normalized MUA for all drug conditions. Bar graphs show mean ± s.e.m. (* = p < 0.05; ** = p < 0.01). E: Mean population PFC MU response across channels from the pre-infusion (left), post-Infusion (middle) and pre-post difference (right). F: Reduction in normalized firing rate by PFC subregion. All regions showed significant reductions from baseline that did not differ from one another. (Cg; Cingulate Cortex, Prl; Prelimbic cortex, IL; Infralimbic Cortex, MO; Medial Orbital Cortex).

Similar articles

Cited by

References

    1. Ashe JH, McKenna TM, Weinberger NM, 1989. Cholinergic modulationoffrequency receptive fields in auditory cortex: II. Frequency-specific effects of anticholinesterases provide evidence for a modulatory action of endogenous ACh. Synapse 4, 44–54. - PubMed
    1. Baeg EH, Kim YB, Jang J, Kim HT, Mook-Jung I, Jung MW, 2001. Fast spiking and regular spiking neural correlates of fear conditioning in the medial prefrontal cortex of the rat. Cerebr. Cortex 11, 441–451. - PubMed
    1. Bandrowski AE, Moore SL, Ashe JH, 2001. Cholinergic synaptic potentials in the supragranular layers of auditory cortex. Synapse 41, 118–130. - PubMed
    1. Barak S, 2009. Modeling cholinergic aspects of schizophrenia: focus on the anti-muscarinic syndrome. Behav. Brain Res. 204, 335–351. - PubMed
    1. Barbas H, 2007. Specialized elements of orbitofrontal cortex in primates. Ann. N. Y. Acad. Sci. 1121, 10–32. - PubMed

Publication types

MeSH terms