

Semivariogram and Semimadogram functions as descriptors for AMD diagnosis on SD-OCT topographic maps using Support Vector Machine
- PMID: 30352604
- PMCID: PMC6199757
- DOI: 10.1186/s12938-018-0592-3
Semivariogram and Semimadogram functions as descriptors for AMD diagnosis on SD-OCT topographic maps using Support Vector Machine
Erratum in
-
Correction to: Semivariogram and Semimadogram functions as descriptors for AMD diagnosis on SD-OCT topographic maps using Support Vector Machine.Biomed Eng Online. 2018 Nov 8;17(1):167. doi: 10.1186/s12938-018-0598-x. Biomed Eng Online. 2018. PMID: 30409139 Free PMC article.
Abstract
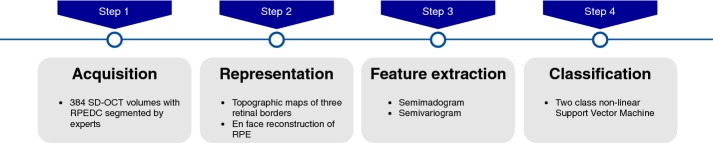
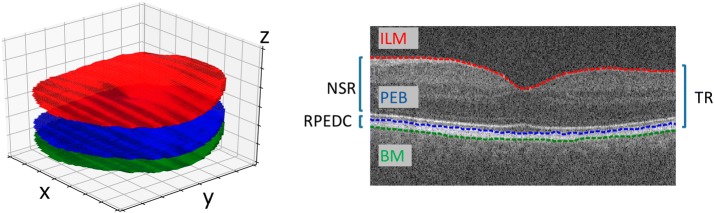
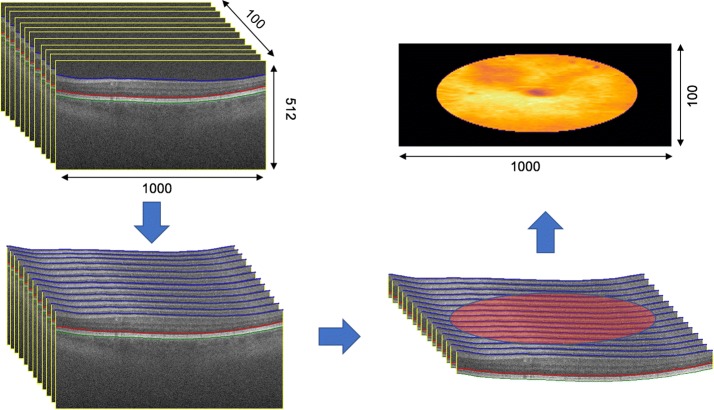
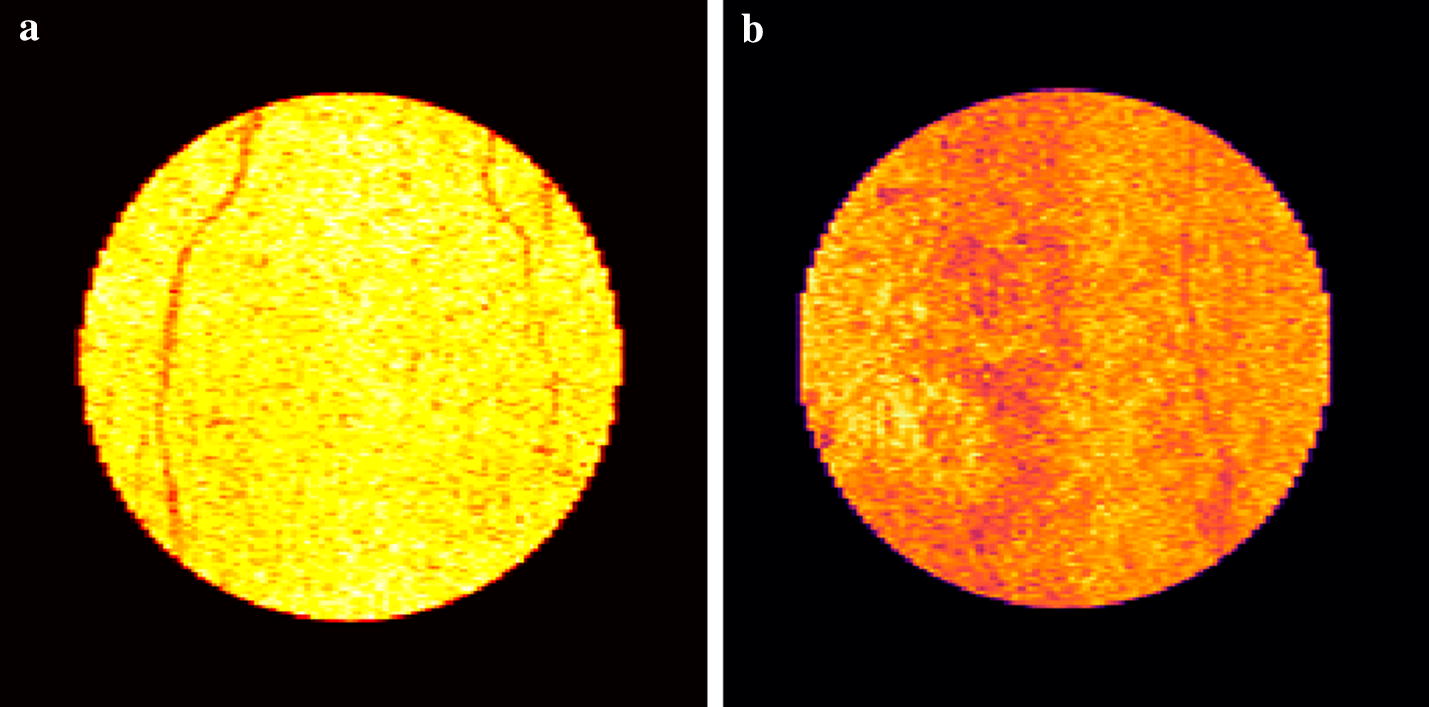
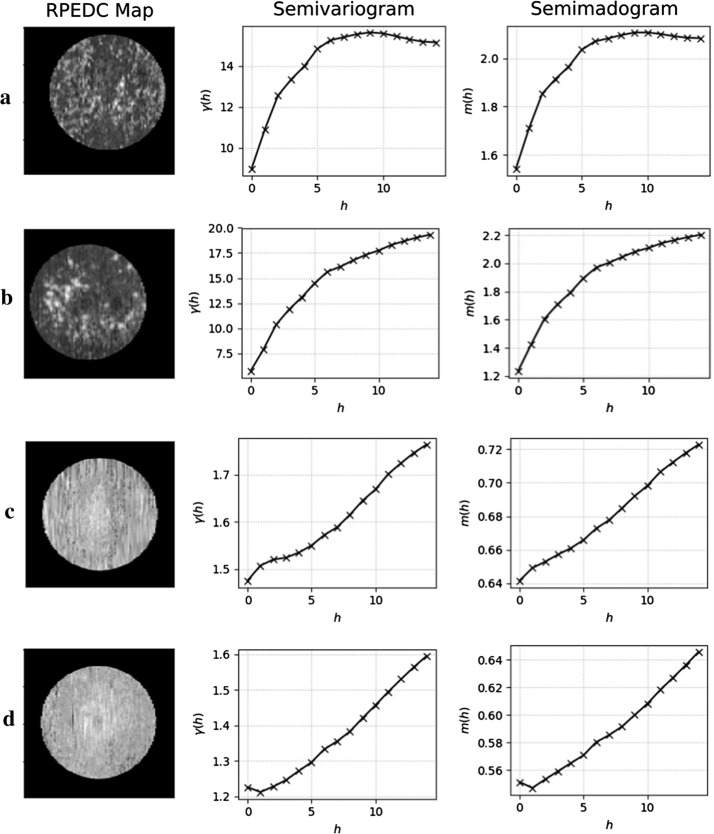
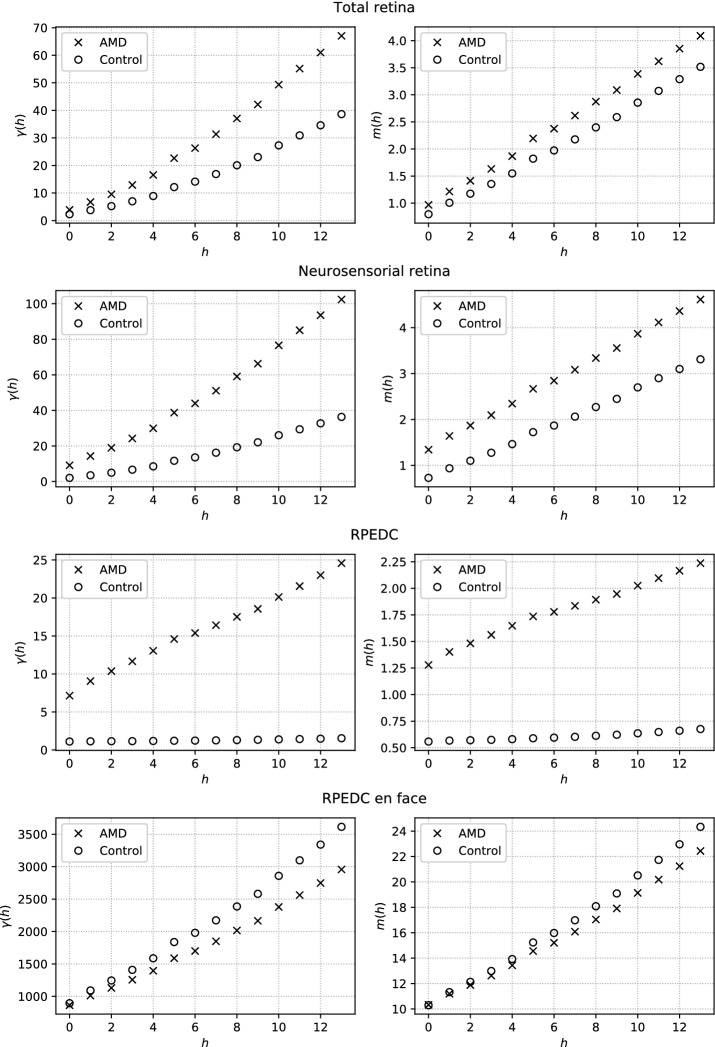
Background: Age-related macular degeneration (AMD) is a degenerative ocular disease that develops by the formation of drusen in the macula region leading to blindness. This condition can be detected automatically by automated image processing techniques applied in spectral domain optical coherence tomography (SD-OCT) volumes. The most common approach is the individualized analysis of each slice (B-Scan) of the SD-OCT volumes. However, it ends up losing the correlation between pixels of neighboring slices. The retina representation by topographic maps reveals the similarity of these structures with geographic relief maps, which can be represented by geostatistical descriptors. In this paper, we present a methodology based on geostatistical functions for the automatic diagnosis of AMD in SD-OCT.
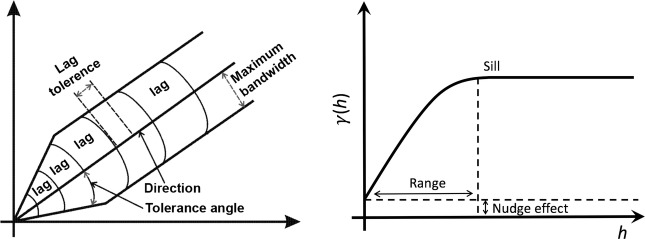
Methods: The proposed methodology is based on the construction of a topographic map of the macular region. Over the topographic map, we compute geostatistical features using semivariogram and semimadogram functions as texture descriptors. The extracted descriptors are then used as input for a Support Vector Machine classifier.
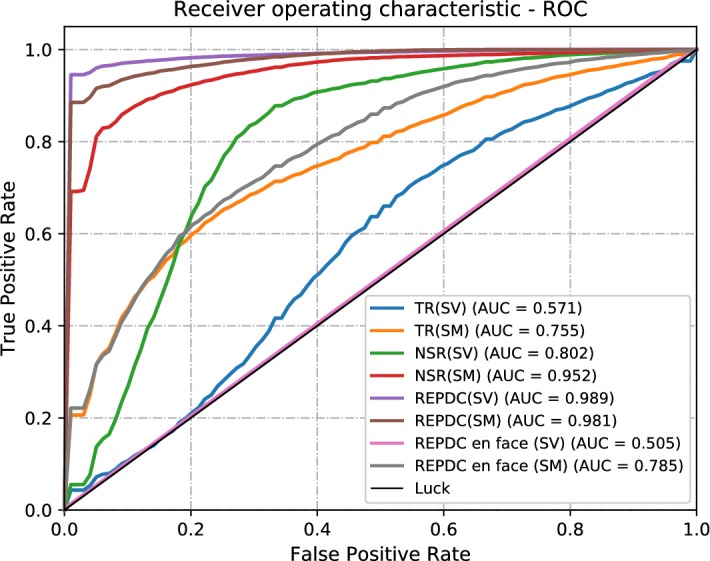
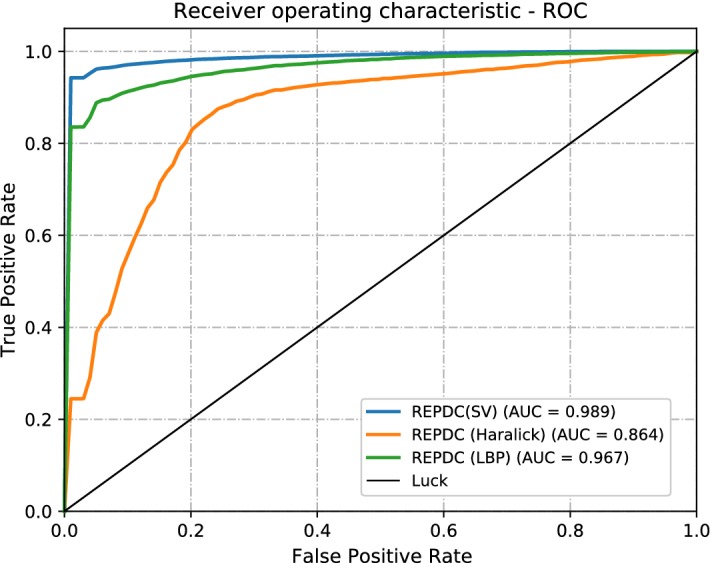
Results: For training of the classifier and tests, a database composed of 384 OCT exams (269 volumes of eyes exhibiting AMD and 115 control volumes) with layers segmented and validated by specialists were used. The best classification model, validated with cross-validation k-fold, achieved an accuracy of 95.2% and an AUROC of 0.989.
Conclusion: The presented methodology exclusively uses geostatistical descriptors for the diagnosis of AMD in SD-OCT images of the macular region. The results are promising and the methodology is competitive considering previous results published in literature.
Keywords: CAD-x; Medical images; Optical coherence tomography; Semimadogram; Semivariogram.
Figures
References
-
- Bordon AF, Oshima A, Guia TA, Calucci D, Sallum JMF, Farah ME. Avaliação da tomografia de coerência óptica em pacientes portadores de degeneração macular relacionada à idade tratada com terapia fotodinâmica com verteporfina. Arquivos Brasileiros de Oftalmologia. 2008;71(6):799–804. doi: 10.1590/S0004-27492008000600006. - DOI - PubMed
-
- Liu Y-Y, Ishikawa H, Chen M, Wollstein G, Duker JS, Fujimoto JG, Schuman JS, Rehg JM. Computerized macular pathology diagnosis in spectral domain optical coherence tomography scans based on multiscale texture and shape features. Invest Ophthalmol Vis Sci. 2011;52(11):8316–8322. doi: 10.1167/iovs.10-7012. - DOI - PMC - PubMed
MeSH terms
LinkOut - more resources
Full Text Sources
Medical
Miscellaneous
