. 2018 Oct 23;6(1):190.
doi: 10.1186/s40168-018-0569-2.

Species-level bacterial community profiling of the healthy sinonasal microbiome using Pacific Biosciences sequencing of full-length 16S rRNA genes

Affiliations

Species-level bacterial community profiling of the healthy sinonasal microbiome using Pacific Biosciences sequencing of full-length 16S rRNA genes

Joshua P Earl et al. Microbiome. .

Abstract

Background: Pan-bacterial 16S rRNA microbiome surveys performed with massively parallel DNA sequencing technologies have transformed community microbiological studies. Current 16S profiling methods, however, fail to provide sufficient taxonomic resolution and accuracy to adequately perform species-level associative studies for specific conditions. This is due to the amplification and sequencing of only short 16S rRNA gene regions, typically providing for only family- or genus-level taxonomy. Moreover, sequencing errors often inflate the number of taxa present. Pacific Biosciences' (PacBio's) long-read technology in particular suffers from high error rates per base. Herein, we present a microbiome analysis pipeline that takes advantage of PacBio circular consensus sequencing (CCS) technology to sequence and error correct full-length bacterial 16S rRNA genes, which provides high-fidelity species-level microbiome data.

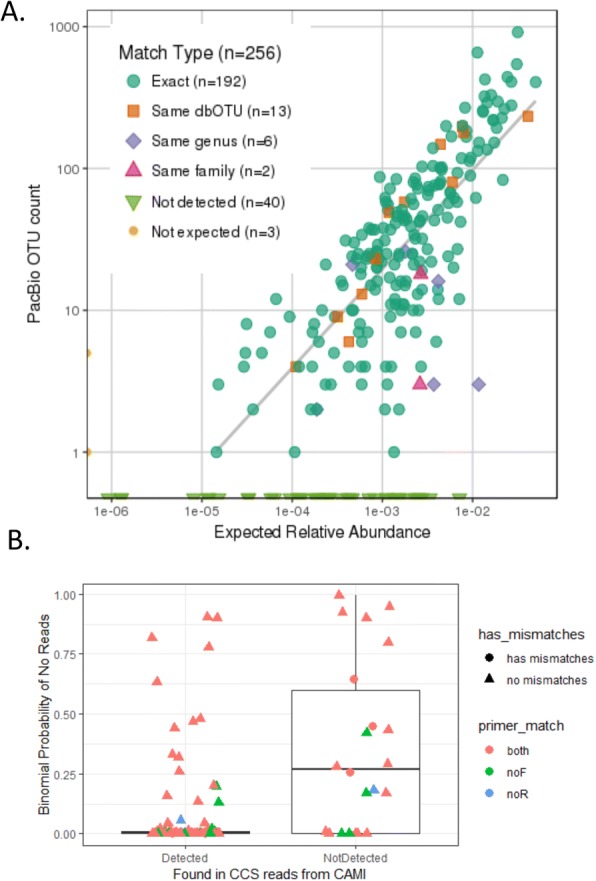
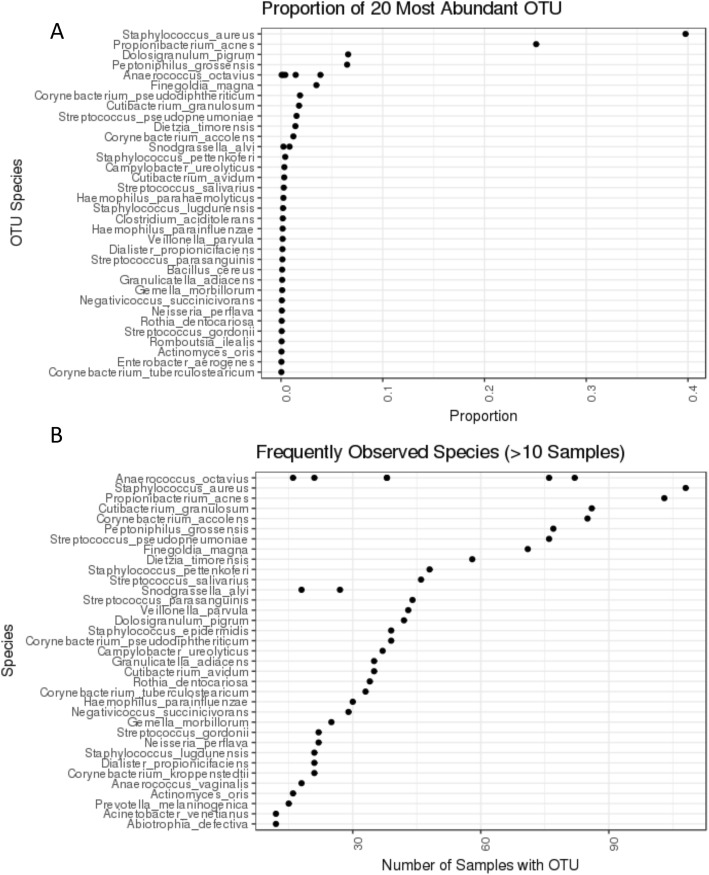
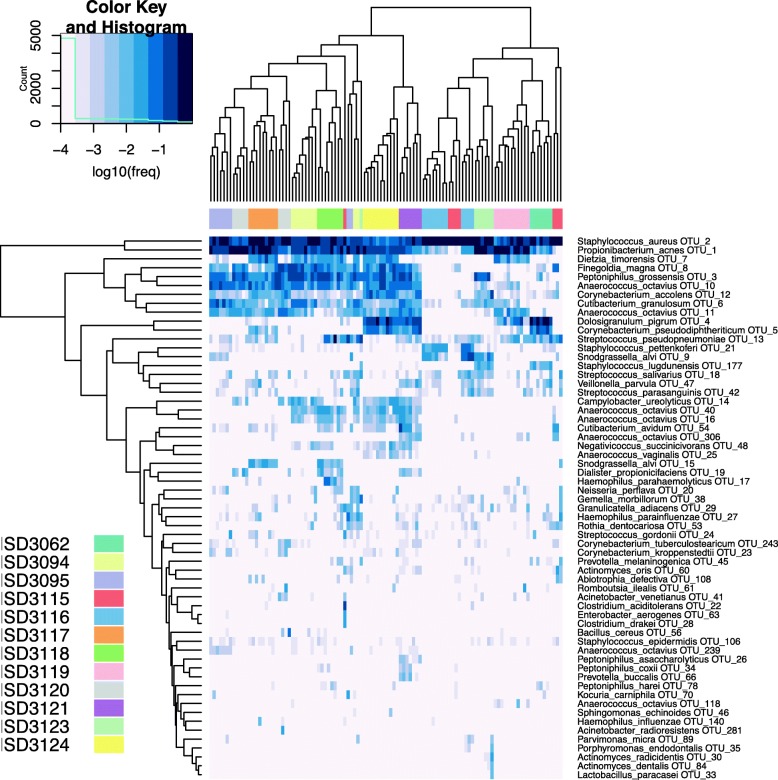
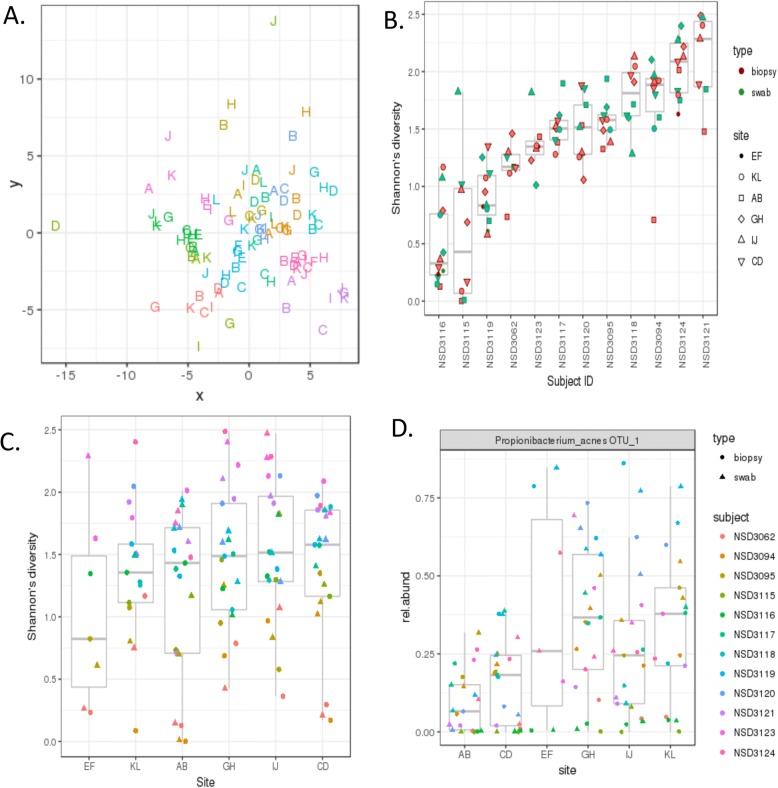
Results: Analysis of a mock community with 20 bacterial species demonstrated 100% specificity and sensitivity with regard to taxonomic classification. Examination of a 250-plus species mock community demonstrated correct species-level classification of > 90% of taxa, and relative abundances were accurately captured. The majority of the remaining taxa were demonstrated to be multiply, incorrectly, or incompletely classified. Using this methodology, we examined the microgeographic variation present among the microbiomes of six sinonasal sites, by both swab and biopsy, from the anterior nasal cavity to the sphenoid sinus from 12 subjects undergoing trans-sphenoidal hypophysectomy. We found greater variation among subjects than among sites within a subject, although significant within-individual differences were also observed. Propiniobacterium acnes (recently renamed Cutibacterium acnes) was the predominant species throughout, but was found at distinct relative abundances by site.

Conclusions: Our microbial composition analysis pipeline for single-molecule real-time 16S rRNA gene sequencing (MCSMRT, https://github.com/jpearl01/mcsmrt ) overcomes deficits of standard marker gene-based microbiome analyses by using CCS of entire 16S rRNA genes to provide increased taxonomic and phylogenetic resolution. Extensions of this approach to other marker genes could help refine taxonomic assignments of microbial species and improve reference databases, as well as strengthen the specificity of associations between microbial communities and dysbiotic states.

Keywords: 16S rRNA; Circular consensus sequencing; Database; Long-read DNA sequencing; Microbiome; Paranasal sinuses; Sinonasal.


Conflict of interest statement

Ethics approval and consent to participate

The Institutional Review Board at The University of Pennsylvania School of Medicine provided full study approval, and informed consent was obtained pre-operatively from all patients.

Consent for publication

Not applicable.

Competing interests

The authors declare that they have no competing interests.

Publisher’s Note

Springer Nature remains neutral with regard to jurisdictional claims in published maps and institutional affiliations.

Figures

Fig. 1
Fig. 1
Overview of the MCSMRT pipeline represented as a flowchart. MCSMRT analysis of 16S rRNA reads from the PacBio is carried out in two steps: In the pre-clustering step, CCS reads are generated during demultiplexing, labeled by sample, pooled together, and then filtered based on several criteria (length distribution, terminal matches to the primer sequences, and not aligning to a provided host or background genome sequence). Before the clustering step, CCS reads are filtered based on cumulative expected error (EE < 1). The clustering pipeline uses UCLUST to identify and sort unique sequences based on their abundance, clusters CCS reads into OTUs (filtering out chimeric reads during clustering), and then using uchime after clustering as a second chimera removal step. An OTU count table is created by mapping the filtered results from the end of the pre-clustering pipeline, and each OTU is taxonomically classified based on a representative “centroid” sequence. Taxonomic classification is also applied to all filtered reads, and ASV detection by MED can be applied on multiple alignments of sets of related sequencing, grouped by either OTU or binned by taxonomic level
Fig. 2
Fig. 2
Distribution of reads at different CCS passes and cumulative expected error values (EE) in the BEI mock community. Violin plot showing the distribution of cumulative EE (after primer matching and trimming) at different CCS passes. Reads with less than two CCS passes were not reported by PacBio CCS software. Histograms at the top and right show read count by CCS and EE, respectively. The 35 reads with 26 to 46 CCS passes are not shown (median EE = 0.22). Subsequent analyses used only CCS reads with > 4 passes
Fig. 3
Fig. 3
Clustering of post-filtered CCS reads into OTUs. a Count of total, unique, CHIM1, and centroid OTU reads at different maximum EE thresholds. b Count of total OTU detected using full-length or truncated reads at different maximum EE thresholds
Fig. 4
Fig. 4
Approximate maximum likelihood phylogenetic tree reconstruction of staphylococcal 16S sequences representing the ASV nodes identified by MED, along with staphylococcal NCBI database entries (midpoint rooting). Each filled tip symbol represents a single MED node, and its size represents the number of reads belonging to that node. Unfilled symbols indicate NCBI database entries. Color indicates the taxonomic assignment for the two expected species with others indicated with gray. a Using FL16S (48 MED node representatives). b Using truncated V3-V5 16S (33 MED node representatives)
Fig. 5
Fig. 5
CAMI mock community composition. a Observed count versus expected relative abundance, based on matching centroid OTU assignments with expected species composition. b Boxplot comparing detected and undetected CAMI clusters, based on the binomial probability of observing no reads, given an expected relative abundance and total EE1-filtered read count (n = 6878). Colors and symbols indicate whether primers aligned or had mismatches to a putative full-length 16S rRNA identified in the whole genome shotgun assemblies created by the CAMI project (119 16S rRNA genes that mapped to 119 CAMI clusters); this excluded all cases where neither primer could be found
Fig. 6
Fig. 6
Schematic diagrams in the sagittal and coronal planes of the human sinonasal cavity. Sites of sampling for microbiome analysis: deep nasal vestibule swab, deep to the vibrissae past the squamous mucosal epithelial junction (a), head of inferior turbinate swab (b), middle meatus swab (c), uncinate process biopsy (d), maxillary sinus swab (e) and biopsy (f), ethmoid sinus swab (g) and biopsy (h), superior meatus swab (i) and biopsy (j), and sphenoid sinus swab (k) and biopsy (l). Figure adapted from “Atlas of Endoscopic Sinus and Skull Base Surgery,” ed. Palmer, J.N., Chiu, A.G., Adappa N.D. Elsevier, Philadelphia (2013)
Fig. 7
Fig. 7
Composition of the sinonasal community. Multiple dots indicate that more than one OTU was classified as the same species. a Overall relative abundance of the top 20 most abundant species. b Number of species observed in 10 or more samples
Fig. 8
Fig. 8
Maximum likelihood phylogenetic trees of ASVs (MED node representatives) from the human sinonasal community belonging to the Staphylococcus OTU, along with staphylococcus NCBI database entries. a FL16S reads and b V3-V5 truncated reads, as in Fig. 4. Only species detected in one or both dataset are given a non-gray tip color
Fig. 9
Fig. 9
Heatmap of human sinonasal microbiome from 12 subjects. Columns are subjects; rows are species. OTU counts were summed by species-level centroid classification, samples with < 500 reads were excluded, then species with < 0.2% relative abundance in all samples were dropped. Remaining OTU counts were converted to relative abundances and then log-transformed after adding a pseudocount (1 / # of reads in sample) before hierarchical clustering, showing strong clustering by subject (horizontal colored strip, with different colors indicating the sample’s subject)
Fig. 10
Fig. 10
Diversity of the human sinonasal microbiome by patient, site, and type. a NMDS ordination of log-transformed Euclidean distance matrix of relative OTU abundances in human sinonasal specimens. Some clustering is observed by patient (color), little to no clustering by site (size), or type (shape). b Box-plot of the variation in diversity among sites. The x-axis has all the sites used in the sinonasal community sequencing, and the y-axis represents the diversity. Coloring is based on the sample type (swab or biopsy). c OTU richness and Shannon’s effective number of OTU. Box-plot of number of OTUs observed in each patient. The colors are based sample type (swab or biopsy). d Box-plot of Shannon’s effective number of species observed in each patient. The colors are based sample type (swab or biopsy)

Similar articles

Cited by

References

    1. Woese CR. Bacterial evolution. Microbiol Rev. 1987;51(2):221–271. - PMC - PubMed
    1. Woese CR, Fox GE. Phylogenetic structure of the prokaryotic domain: the primary kingdoms. Proc Natl Acad Sci U S A. 1977;74(11):5088–5090. doi: 10.1073/pnas.74.11.5088. - DOI - PMC - PubMed
    1. Lane DJ, Pace B, Olsen GJ, Stahl DA, Sogin ML, Pace NR. Rapid determination of 16S ribosomal RNA sequences for phylogenetic analyses. Proc Natl Acad Sci U S A. 1985;82(20):6955–6959. doi: 10.1073/pnas.82.20.6955. - DOI - PMC - PubMed
    1. Olsen GJ, Woese CR. Ribosomal RNA: a key to phylogeny. FASEB J. 1993;7(1):113–123. doi: 10.1096/fasebj.7.1.8422957. - DOI - PubMed
    1. Welch DBM, Mark Welch DB, Huse SM. Handbook of molecular microbial ecology II. 2011. Microbial diversity in the deep sea and the underexplored “rare biosphere”; pp. 243–252. - PMC - PubMed

Publication types

LinkOut - more resources