

Active Site Breathing of Human Alkbh5 Revealed by Solution NMR and Accelerated Molecular Dynamics
- PMID: 30352661
- PMCID: PMC6303414
- DOI: 10.1016/j.bpj.2018.10.004
Active Site Breathing of Human Alkbh5 Revealed by Solution NMR and Accelerated Molecular Dynamics
Abstract
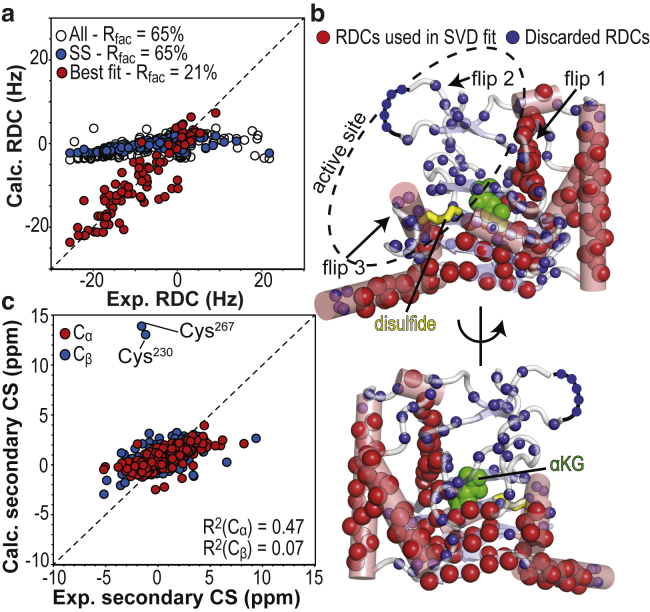
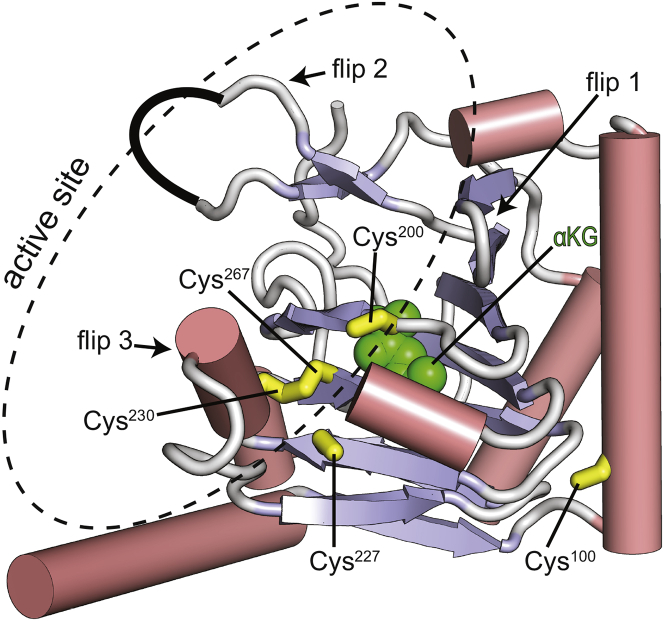
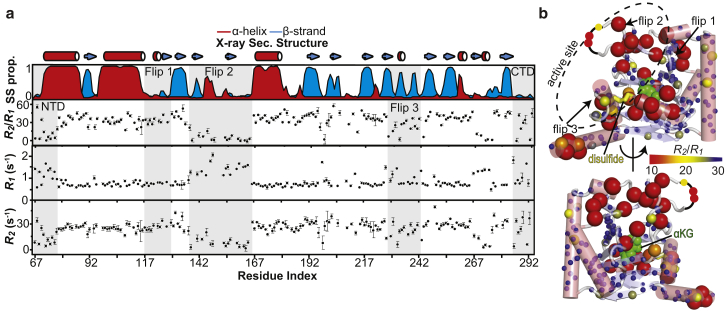
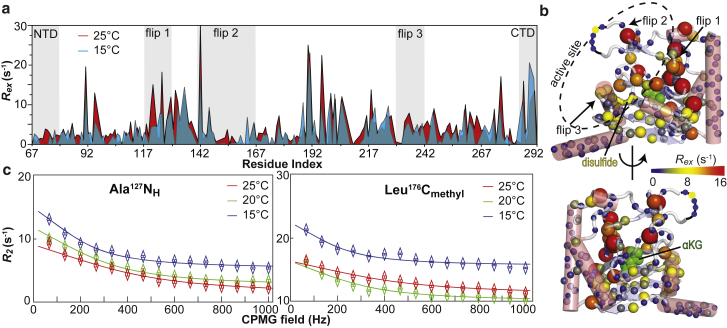
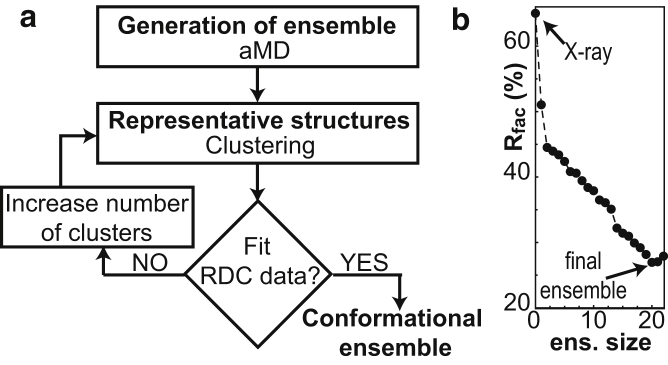
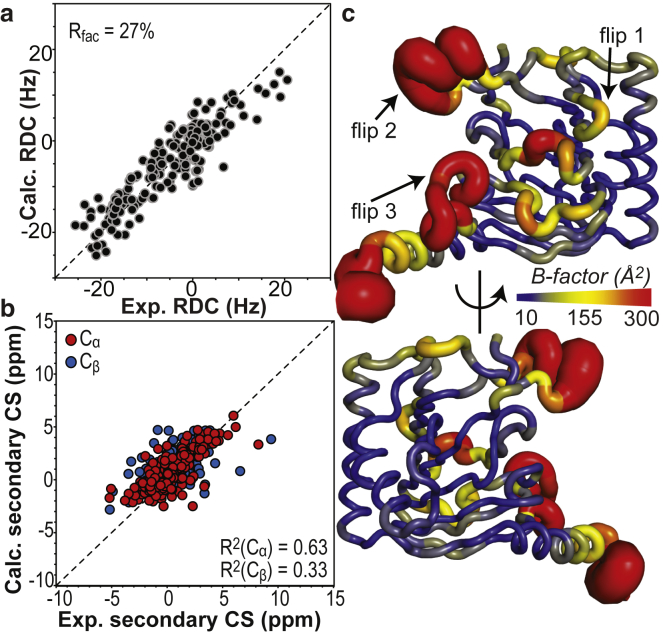
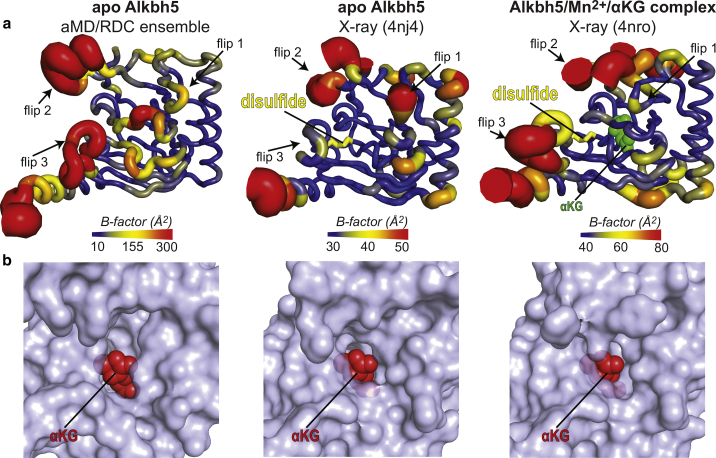
AlkB homolog 5 (Alkbh5) is one of nine members of the AlkB family, which are nonheme Fe2+/α-ketoglutarate-dependent dioxygenases that catalyze the oxidative demethylation of modified nucleotides and amino acids. Alkbh5 is highly selective for the N6-methyladenosine modification, an epigenetic mark that has spawned significant biological and pharmacological interest because of its involvement in important physiological processes, such as carcinogenesis and stem cell differentiation. Herein, we investigate the structure and dynamics of human Alkbh5 in solution. By using 15N and 13Cmethyl relaxation dispersion and 15N-R1 and R1ρ NMR experiments, we show that the active site of apo Alkbh5 experiences conformational dynamics on multiple timescales. Consistent with this observation, backbone amide residual dipolar couplings measured for Alkbh5 in phage pf1 are inconsistent with the static crystal structure of the enzyme. We developed a simple approach that combines residual dipolar coupling data and accelerated molecular dynamics simulations to calculate a conformational ensemble of Alkbh5 that is fully consistent with the experimental NMR data. Our structural model reveals that Alkbh5 is more disordered in solution than what is observed in the crystal state and undergoes breathing motions that expand the active site and allow access to α-ketoglutarate. Disordered-to-ordered conformational changes induced by sequential substrate/cofactor binding events have been often invoked to interpret biochemical data on the activity and specificity of AlkB proteins. The structural ensemble reported in this work provides the first atomic-resolution model of an AlkB protein in its disordered conformational state to our knowledge.
Copyright © 2018 Biophysical Society. Published by Elsevier Inc. All rights reserved.
Figures
Similar articles
-
1H, 15N, 13C backbone resonance assignment of human Alkbh5.Biomol NMR Assign. 2018 Oct;12(2):297-301. doi: 10.1007/s12104-018-9826-3. Epub 2018 Jun 1. Biomol NMR Assign. 2018. PMID: 29858729
-
Distinct RNA N-demethylation pathways catalyzed by nonheme iron ALKBH5 and FTO enzymes enable regulation of formaldehyde release rates.Proc Natl Acad Sci U S A. 2020 Oct 13;117(41):25284-25292. doi: 10.1073/pnas.2007349117. Epub 2020 Sep 28. Proc Natl Acad Sci U S A. 2020. PMID: 32989163 Free PMC article.
-
N 6-methyladenosine binding induces a metal-centered rearrangement that activates the human RNA demethylase Alkbh5.Sci Adv. 2021 Aug 18;7(34):eabi8215. doi: 10.1126/sciadv.abi8215. Print 2021 Aug. Sci Adv. 2021. PMID: 34407931 Free PMC article.
-
Enzyme dynamics from NMR spectroscopy.Acc Chem Res. 2015 Feb 17;48(2):457-65. doi: 10.1021/ar500340a. Epub 2015 Jan 9. Acc Chem Res. 2015. PMID: 25574774 Free PMC article. Review.
-
Human and Arabidopsis alpha-ketoglutarate-dependent dioxygenase homolog proteins-New players in important regulatory processes.IUBMB Life. 2020 Jun;72(6):1126-1144. doi: 10.1002/iub.2276. Epub 2020 Mar 23. IUBMB Life. 2020. PMID: 32207231 Review.
Cited by
-
Role of Structural Dynamics in Selectivity and Mechanism of Non-heme Fe(II) and 2-Oxoglutarate-Dependent Oxygenases Involved in DNA Repair.ACS Cent Sci. 2020 May 27;6(5):795-814. doi: 10.1021/acscentsci.0c00312. Epub 2020 May 8. ACS Cent Sci. 2020. PMID: 32490196 Free PMC article.
-
Structure elucidation of the elusive Enzyme I monomer reveals the molecular mechanisms linking oligomerization and enzymatic activity.Proc Natl Acad Sci U S A. 2021 May 18;118(20):e2100298118. doi: 10.1073/pnas.2100298118. Proc Natl Acad Sci U S A. 2021. PMID: 33975952 Free PMC article.
-
15N CPMG Relaxation Dispersion for the Investigation of Protein Conformational Dynamics on the µs-ms Timescale.J Vis Exp. 2021 Apr 19;(170):10.3791/62395. doi: 10.3791/62395. J Vis Exp. 2021. PMID: 33938889 Free PMC article.
-
The role of RNA m6A demethylase ALKBH5 in the mechanisms of fibrosis.Front Cell Dev Biol. 2024 Aug 16;12:1447135. doi: 10.3389/fcell.2024.1447135. eCollection 2024. Front Cell Dev Biol. 2024. PMID: 39220683 Free PMC article. Review.
-
Solution Structure Ensembles of the Open and Closed Forms of the ∼130 kDa Enzyme I via AlphaFold Modeling, Coarse Grained Simulations, and NMR.J Am Chem Soc. 2023 Jun 21;145(24):13347-13356. doi: 10.1021/jacs.3c03425. Epub 2023 Jun 6. J Am Chem Soc. 2023. PMID: 37278728 Free PMC article.
References
Publication types
MeSH terms
Substances
LinkOut - more resources
Full Text Sources
