. 2019 Apr 1;25(7):2136-2143.
doi: 10.1158/1078-0432.CCR-18-2684. Epub 2018 Oct 23.

Elastography Can Map the Local Inverse Relationship between Shear Modulus and Drug Delivery within the Pancreatic Ductal Adenocarcinoma Microenvironment

Affiliations

Elastography Can Map the Local Inverse Relationship between Shear Modulus and Drug Delivery within the Pancreatic Ductal Adenocarcinoma Microenvironment

Hexuan Wang et al. Clin Cancer Res. .

Abstract

Purpose: High tissue pressure prevents chemotherapeutics from reaching the core of pancreatic tumors. Therefore, targeted therapies have been developed to reduce this pressure. While point probes have shown the effectiveness of these pressure-reducing therapies via single-location estimates, ultrasound elastography is now widely available as an imaging technique to provide real-time spatial maps of shear modulus (tissue stiffness). However, the relationship between shear modulus and the underlying tumor microenvironmental causes of high tissue pressure has not been investigated. In this work, elastography was used to investigate how shear modulus influences drug delivery in situ, and how it correlates with collagen density, hyaluronic acid content, and patent vessel density-features of the tumor microenvironment known to influence tissue pressure.

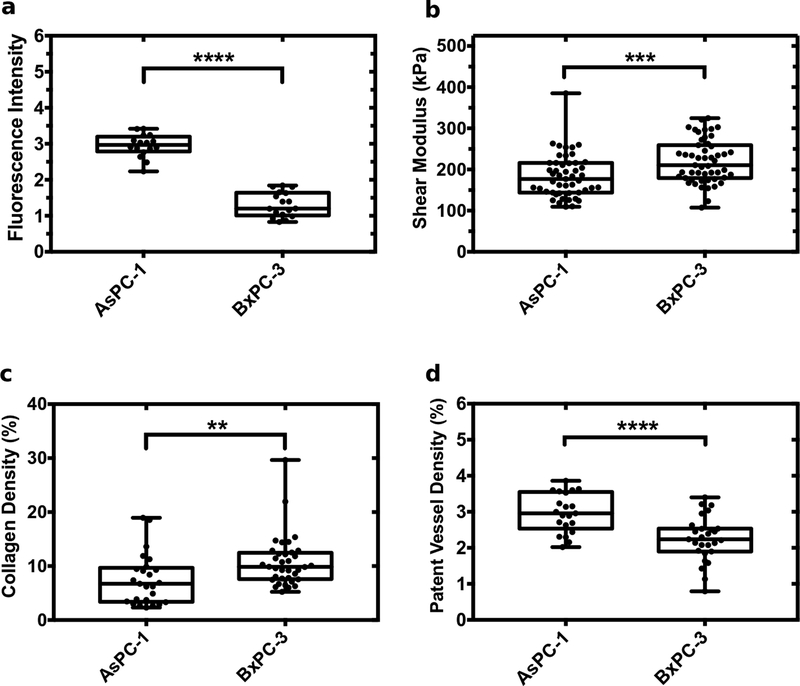
Experimental design: Intravenous injection of verteporfin, an approved human fluorescent drug, was used in two pancreatic cancer xenograft models [AsPC-1 (n = 25) and BxPC-3 (n = 25)].

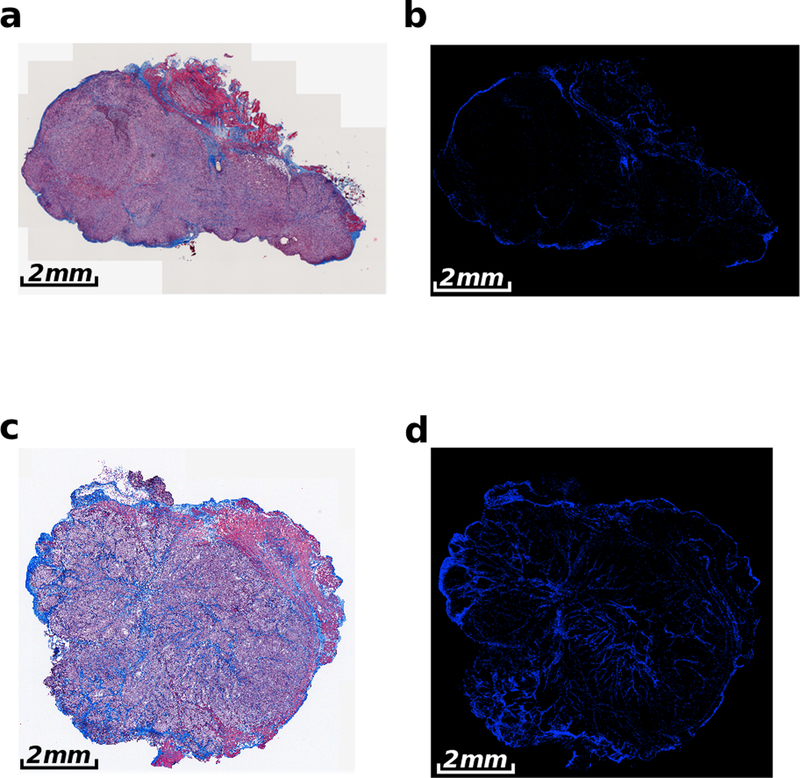
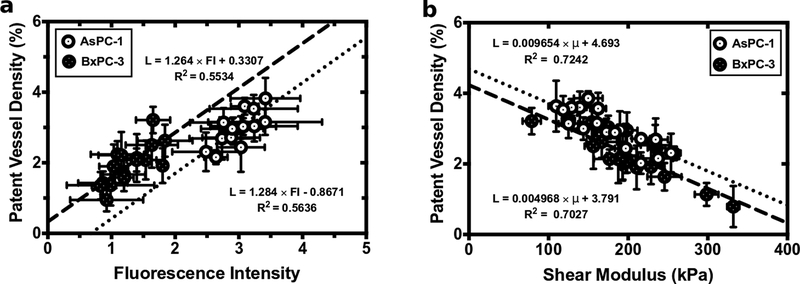
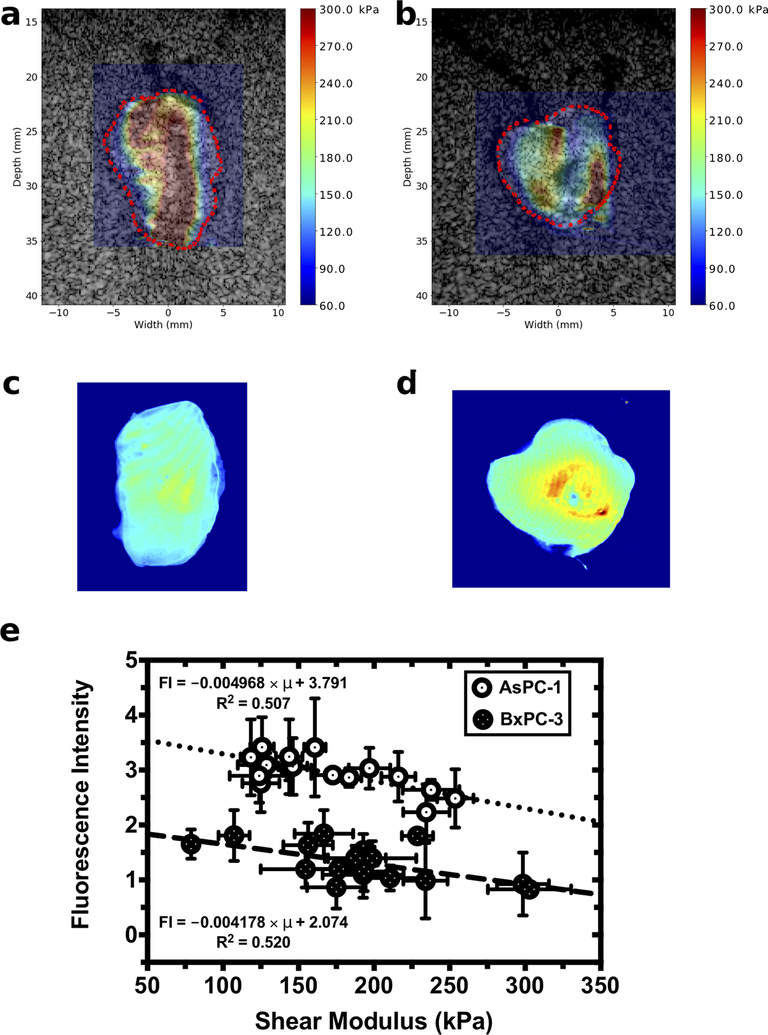
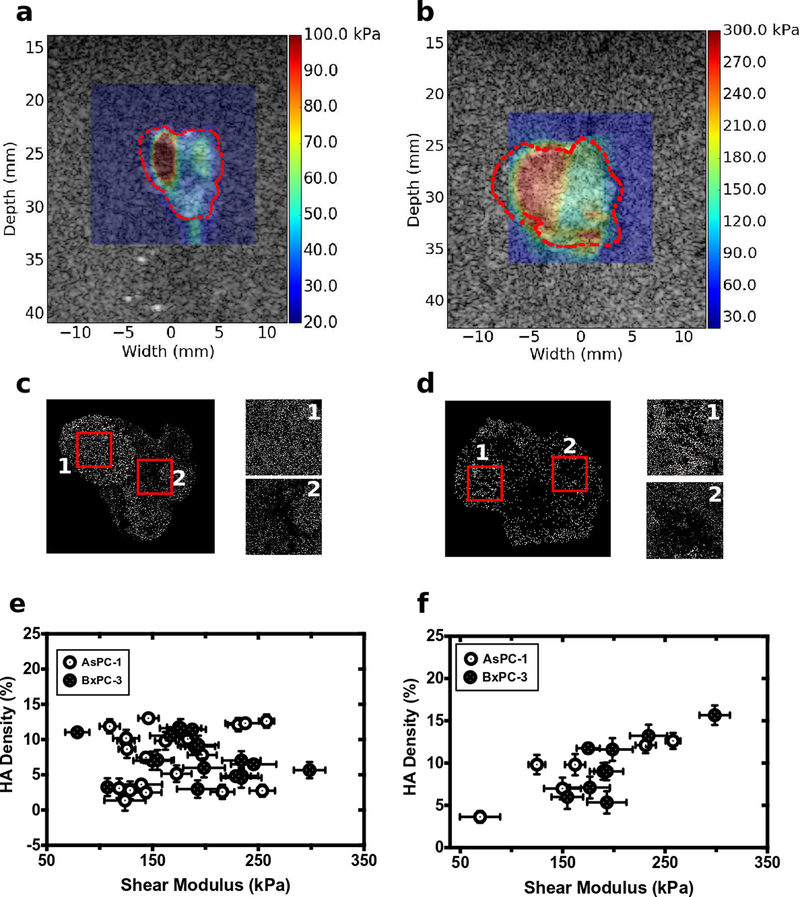
Results: Fluorescence intensity was higher in AsPC-1 tumors than in BxPC-3 tumors (P < 0.0001). Comparing drug uptake images and shear wave elastographic images with histologic images revealed that: (i) drug delivery and shear modulus were inversely related, (ii) shear modulus increased linearly with increasing collagen density, and (iii) shear modulus was marginally correlated with the local assessment of hyaluronic acid content.

Conclusions: These results demonstrate that elastography could guide targeted therapy and/or identify patients with highly elevated tissue pressure.See related commentary by Nia et al., p. 2024.


Conflict of interest statement

Conflict of interest: The authors declare no potential conflicts of interest.

Figures

Figure 1:
Figure 1:
Box plots of elasticity and histological markers measured for AsPC-1 and BxPC-3 tumors. Showing (a) fluorescence intensity of verteporfin, (b) mean shear modulus, (c) collagen density, and (d) patent vessel density. **** represents p < 0.0001, *** represents p values between 0.0001 to 0.001, and ** represents p values between 0.001 to 0.01.
Figure 2:
Figure 2:
Representative Masson’s trichrome stained images of AsPC-1 and BxPC-3 tumors implanted into the pancreas of nude mice. Showing (a) AsPC-1 tumor and (b) color-segmented collagen distribution of the AsPC-1 tumor. (c) BxPC-3 tumor with (d) corresponding color-segmented collagen distribution. The AsPC-1 tumors in (a) and (b) have a collagen density of 5.6 ± 1.4%, in comparison to the collagen density of 12.5 ± 1.1% for the BxPC-3 tumor in (c) and (d).
Figure 3:
Figure 3:
Patent vessel density was compared to (a) calibrated fluorescence intensity and (b) shear modulus for both the AsPC-1 and BxPC-3 tumors.
Figure 4:
Figure 4:
Calibrated fluorescence intensity maps and elastographic imaging obtained from AsPC-1 and BxPC-3 tumors. Shear modulus overlaid on sonograms for a (a) AsPC-1 tumor and (b) BxPC-3 tumor. Calibrated fluorescence intensity maps obtained from the corresponding (c) AsPC-1 and (d) BxPC-3 tumors. (e) Fluorescence intensity plotted as a function of tumor shear modulus.
Figure 5:
Figure 5:
Shear modulus overlaid on sonograms for the representative (a) AsPC-1 and (b) BxPC-3 tumors. (c) and (d) color-segmented hyaluronic acid distributions for the corresponding (c) AsPC-1 and (d) BxPC-3 tumors. Box #1 1 had an HA density of 15.6% with a shear modulus of 298.525 kPa; Box #2 had an HA density of 7.3% and shear modulus of 139 kPa. For the AsPC-1 tumor in (b) and (d), box #1 had an HA density of 9.8% with a shear modulus of 162 kPa; box #2 had an HA density of 3.6% and shear modulus of 69 kPa. (e) shows a scatter plot of global estimate of shear modulus and HA density calculated from whole tumor slice. (f) show a local analysis of shear modulus and HA distribution shown in (c) and (d).

Comment in

Similar articles

Cited by

References

    1. Duggan MA, Anderson WF, Altekruse S, Penberthy L, Sherman ME. The Surveillance, Epidemiology, and End Results (SEER) Program and Pathology: Toward Strengthening the Critical Relationship. Am J Surg Pathol 2016;40(12):e94–e102 doi 10.1097/PAS.0000000000000749. - DOI - PMC - PubMed
    1. Li D, Xie K, Wolff R, Abbruzzese JL. Pancreatic cancer. Lancet 2004;363(9414):1049–57 doi 10.1016/S0140-6736(04)15841-8. - DOI - PubMed
    1. Jemal A, Siegel R, Ward E, Hao Y, Xu J, Thun MJ. Cancer statistics, 2009. CA Cancer J Clin 2009;59(4):225–49 doi 10.3322/caac.20006. - DOI - PubMed
    1. Katz MH, Crane CH, Varadhachary G. Management of borderline resectable pancreatic cancer. Semin Radiat Oncol 2014;24(2):105–12 doi 10.1016/j.semradonc.2013.11.006. - DOI - PubMed
    1. Lal A, Christians K, Evans DB. Management of borderline resectable pancreatic cancer. Surg Oncol Clin N Am 2010;19(2):359–70 doi 10.1016/j.soc.2009.11.006. - DOI - PubMed